Lesson 4. Trend Lines for Binary Options
In this lesson, we will address the following topics:
- What is a trend?
- How can you identify a trend?
- What are bulls and bears in the stock market?
- What are support and resistance levels?
1. What is a trend?
Currency quotes are constantly moving and each movement has a course, or direction.
The direction of a quote’s movement is called a trend. When it rises, it is considered an “upward” trend, and when it falls, it is considered a “downward” trend.
There are also “horizontal”, or “flat” trends, which exhibit no significant fluctuations. Flat trends lack significant fluctuations in price.

Correctly identifying extant trends will allow you to adjust to the market and trade profitably.
2. How can you identify a trend?
This is where analytics tools come to the rescue, the simplest of which is a line chart. The trend line can be easily displayed on a chart by connecting the price highs or lows with a series of points. The more often it touches the price, the stronger the trend.
LIFEHACK: Use the Trend Line tool to plot a trend on a graph yourself.
Can you spot the ongoing trend? Test your intuition with Pocket Option. It’s totally free!
3. What are bulls and bears on the stock market?
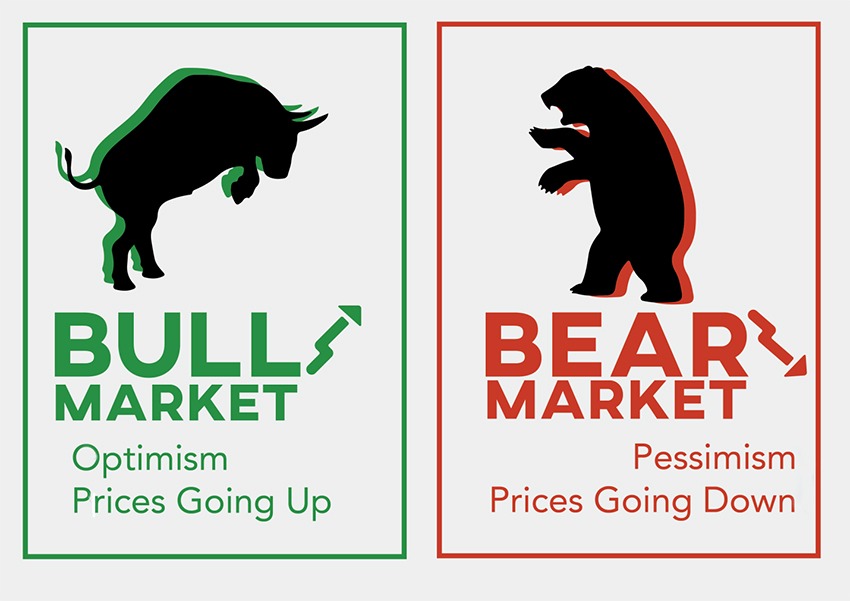
Bulls are traders who play on an uptrend. They take trades when the market is climbing, preferring to acquire assets at low prices and capitalize on growth. They do so with confidence that the price will rise. The name “bull” is thought to come from the fact that bulls attack their opponents with an upward slash of their horns.

4. What to do in a bull market
This is as easy as it gets: buy currency at a lower price and sell it at a higher price!
Bear traders base their strategies on selling. They play to lower the price of the asset and make their money on the cheaper price.
Unlike bulls, bears attack with downward swipes of their paws. A bear trader’s goal is to squeeze the price to the bottom, pushing it to collapse.
5. What to do in a bear market
Your goal should be to wait for the end of the bear market in order to acquire assets at an advantageous price.
Support and resistance levels
Quotes are constantly in motion, but at a certain point in time the price will reach one of two places:
- the resistance level, or such a high level that bear traders will no longer want to sell assets and bull traders will willingly buy.
- the support level, or the level that is so low that bulls no longer want to sell assets, while bears, on the contrary, seek to buy.
As you can see on the graph, the resistance level is the price peak and the support level is the bottom of the trough. Prices can “bounce” or “break” it and change direction after hitting one of these levels.
Before starting a trade, traders determine the day’s support and resistance levels, which allows them to:
- find signs pointing to a trend’s continuation or reversal;
- enter the market during a period of calm at an advantageous price;
- open deals at the very beginning of a trend and increase profits.