




AB=CD Trading Strategy for Binary Options
The AB=CD pattern is one of the fundamental trading patterns used in binary options trading. Thanks to its versatility, it is particularly well-suited for beginners. The strategy is incredibly easy to learn while remaining sufficiently effective. Even experienced traders regularly use it when trading binary options.
In this article, you will learn the rules for applying the AB=CD pattern under different market conditions. We will examine the structure of this harmonic pattern in detail and explain how to analyze the market using it. You will also find practical examples demonstrating the effectiveness of the AB=CD pattern in binary options trading.
In This Article, You Will Learn:
How Does the AB=CD Pattern Work?
The Structure of the AB=CD Pattern
Bullish AB=CD Pattern
Bearish AB=CD Pattern
How to Trade Binary Options Using the AB=CD Pattern
How Does the AB=CD Pattern Work?
When making market predictions, traders rely on chart patterns—specific geometric formations that appear on financial asset price charts. Combined with various indicators and other technical tools, these patterns help traders analyze current market conditions.
Harmonic patterns deserve special attention because their structure differs from that of traditional chart patterns. They can also be identified on financial asset charts, but their components are connected by specific mathematical relationships. The distances between pattern elements are measured using principles based on the golden ratio.
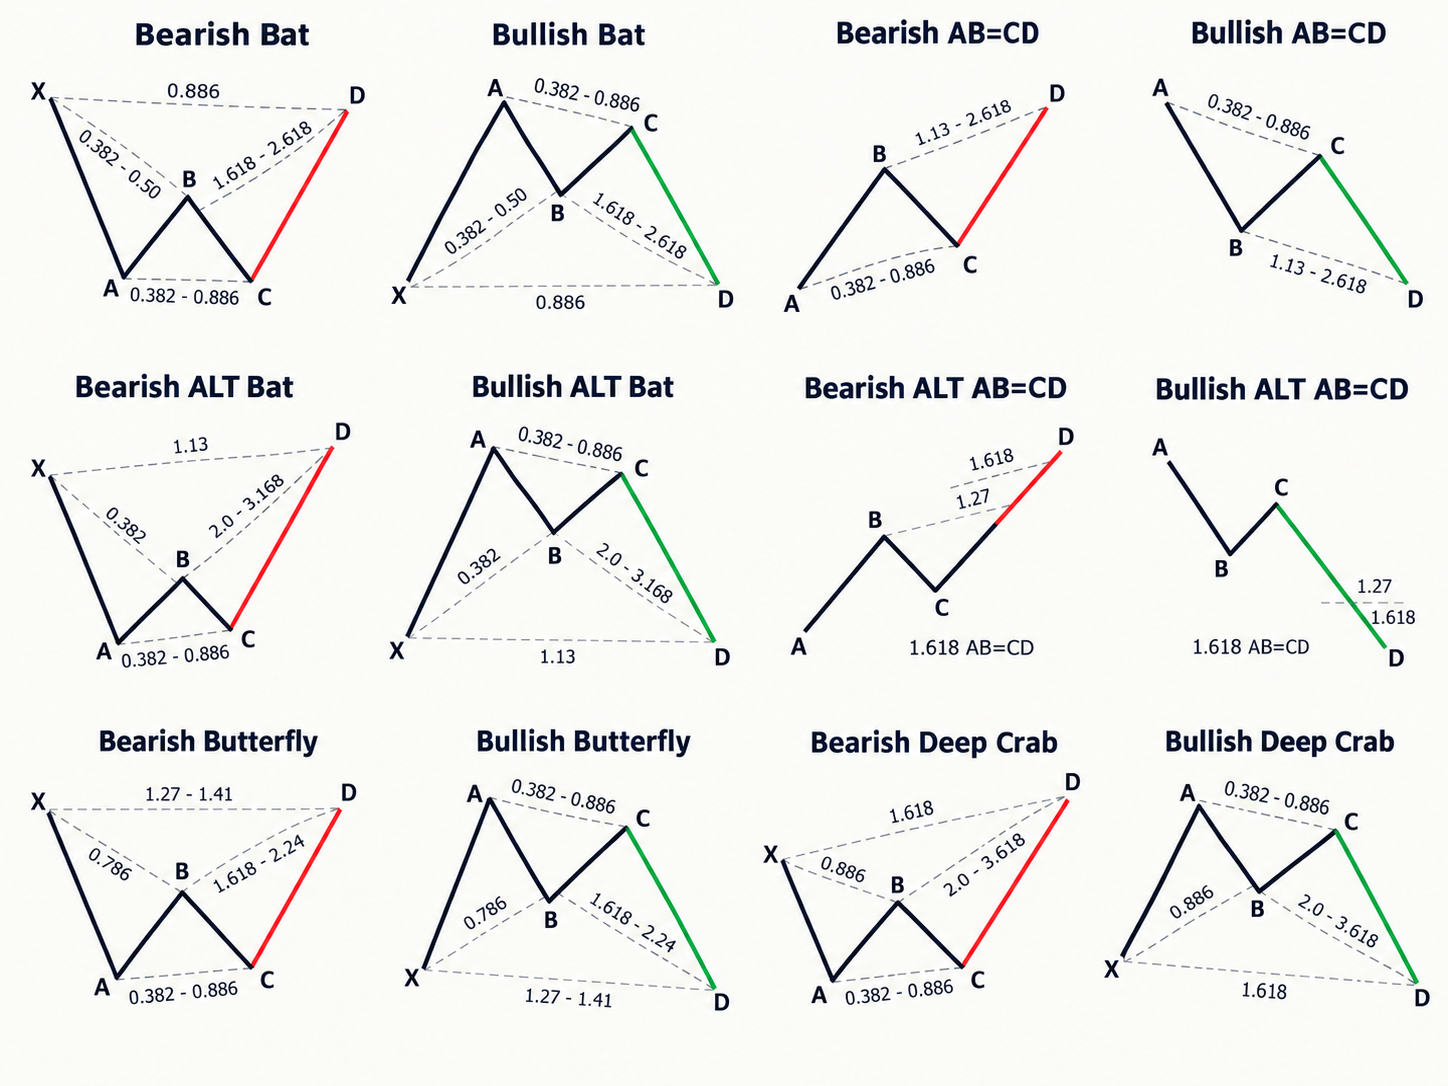
Examples of popular trading patterns
One of the most important patterns in trading is the AB=CD pattern, also known as ABCD. Its shape resembles the Latin letter N. There are both bullish and bearish variations of this pattern. It is considered a reversal pattern, meaning it signals a potential change in the prevailing market trend.
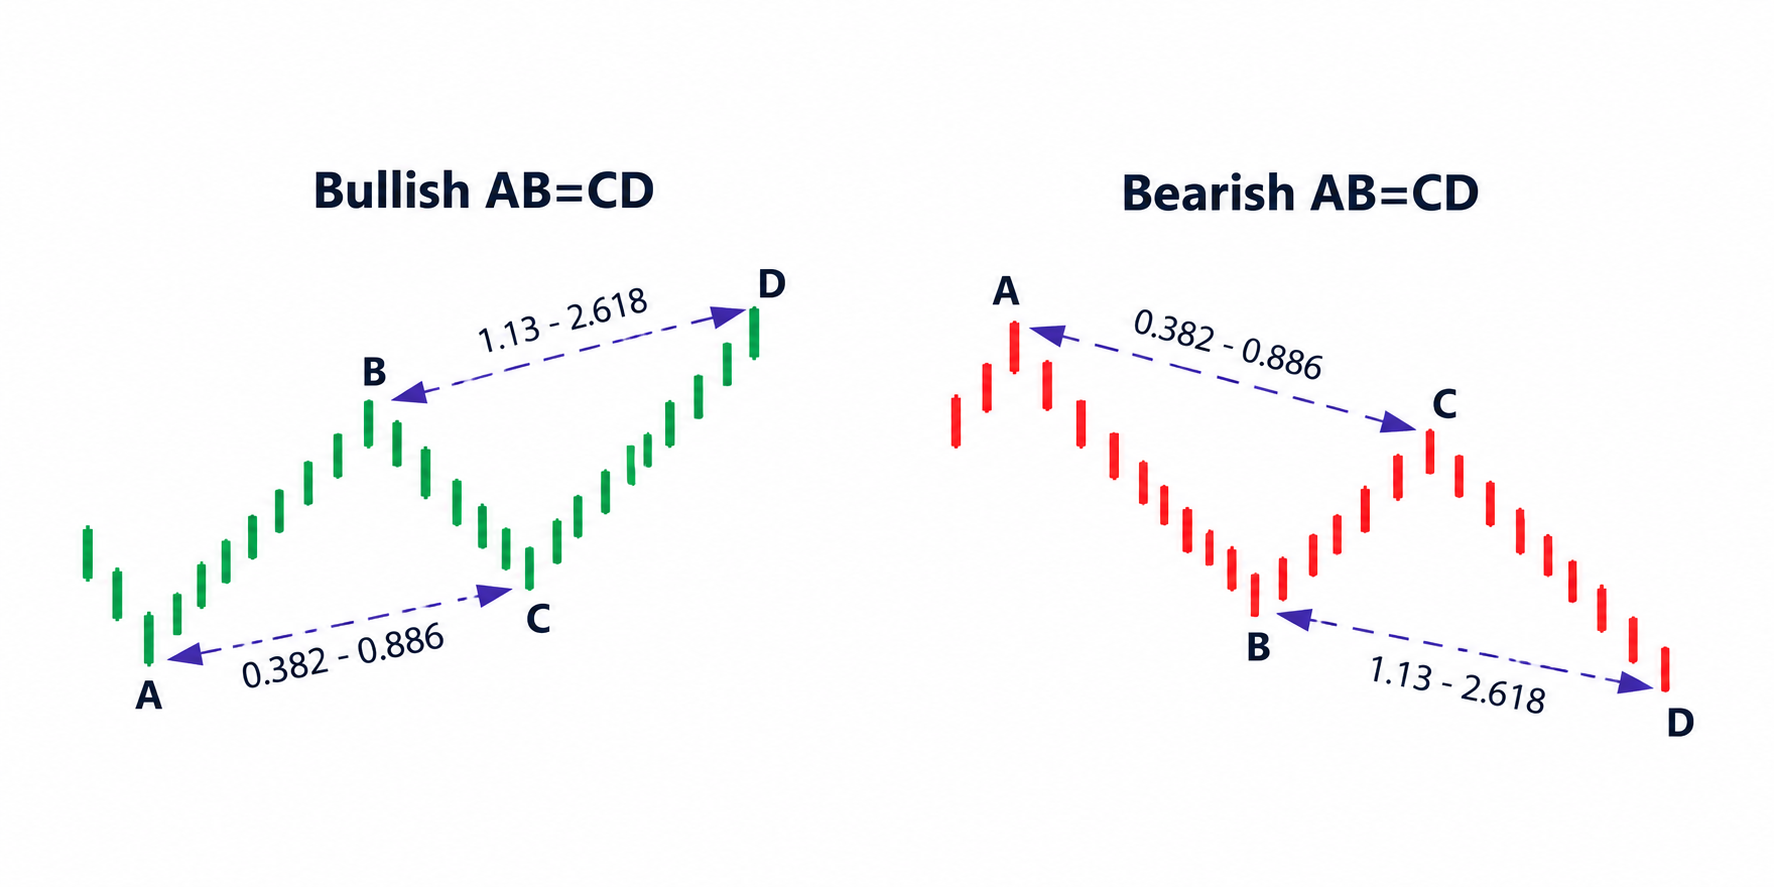
Bullish (left) and Bearish (right) variations of the AB=CD pattern
The AB=CD pattern begins with the asset's price moving in a new direction from point A, eventually producing a significant price movement toward point B. The price then retraces to point C before resuming its movement until it covers a distance equal to the length of segment AB, reaching point D.
When segment CD reaches a length equivalent to segment AB, traders can expect a reversal of the CD price movement.
If the pattern is confirmed, traders can identify entry points at the very beginning of the developing reversal following segment CD. The goal is to open a trade immediately after the price reverses from the CD movement.
The Structure of the AB=CD Pattern
The Bullish AB=CD pattern begins with a price decline (segment AB), followed by a reversal and an upward movement (segment BC). The price then changes direction again and resumes its bearish movement (segment CD), falling below the previous low formed at point B.
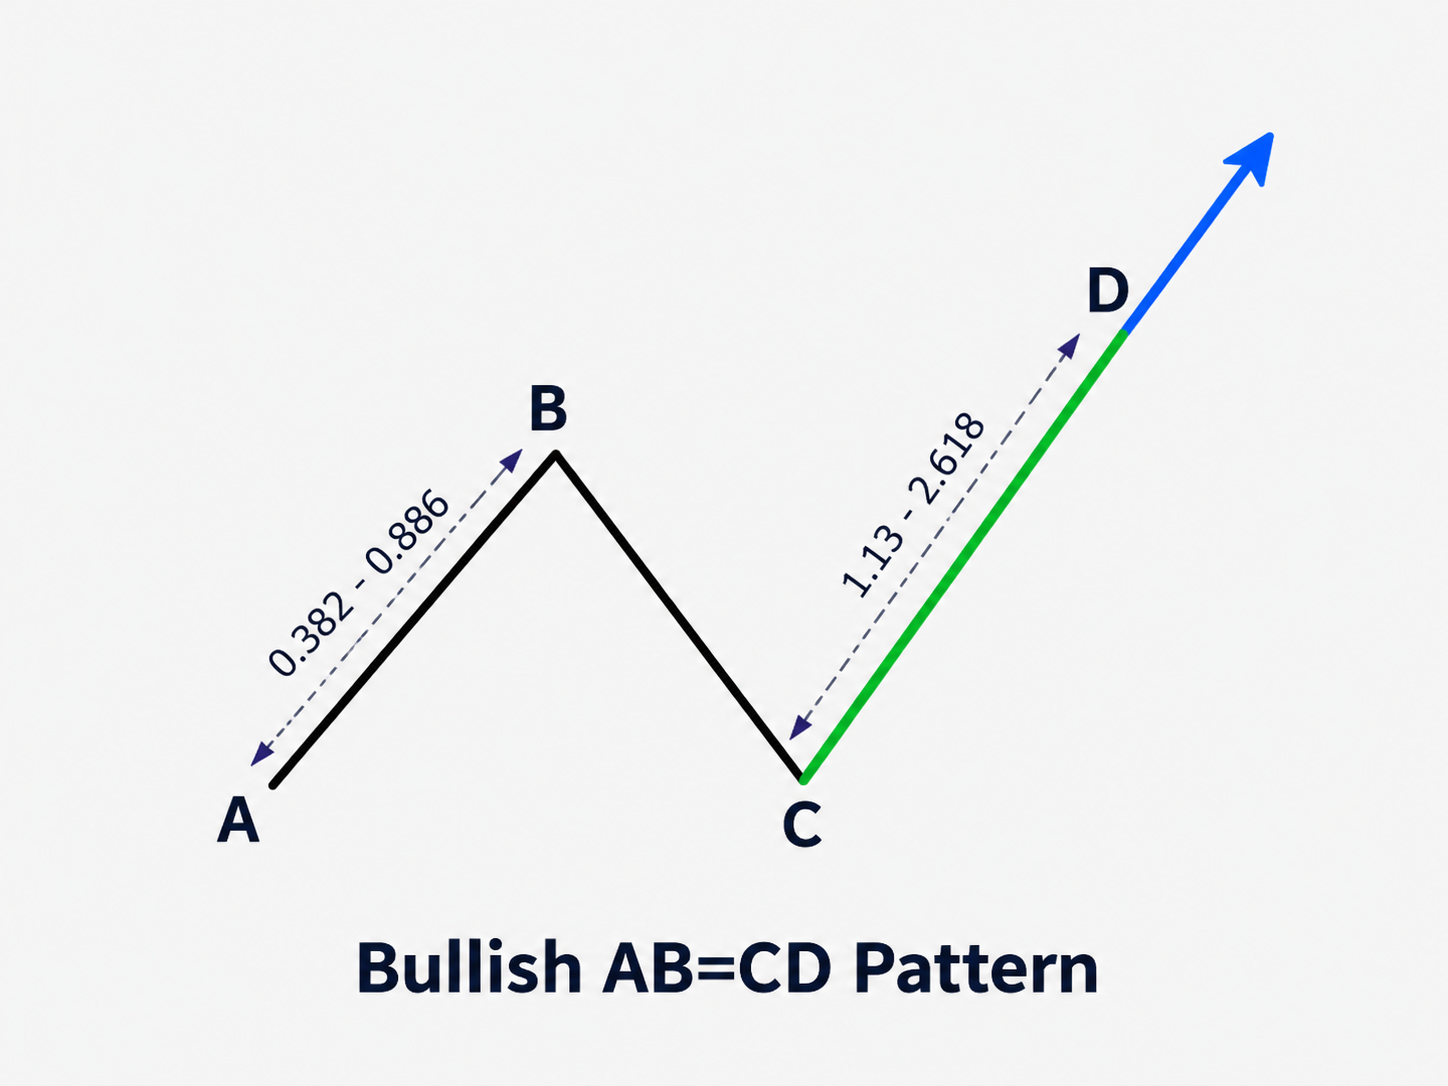
Bullish AB=CD pattern
The image shows a typical Bullish AB=CD pattern. After the final downward price movement (segment CD) is completed, a reversal and subsequent price increase are expected.
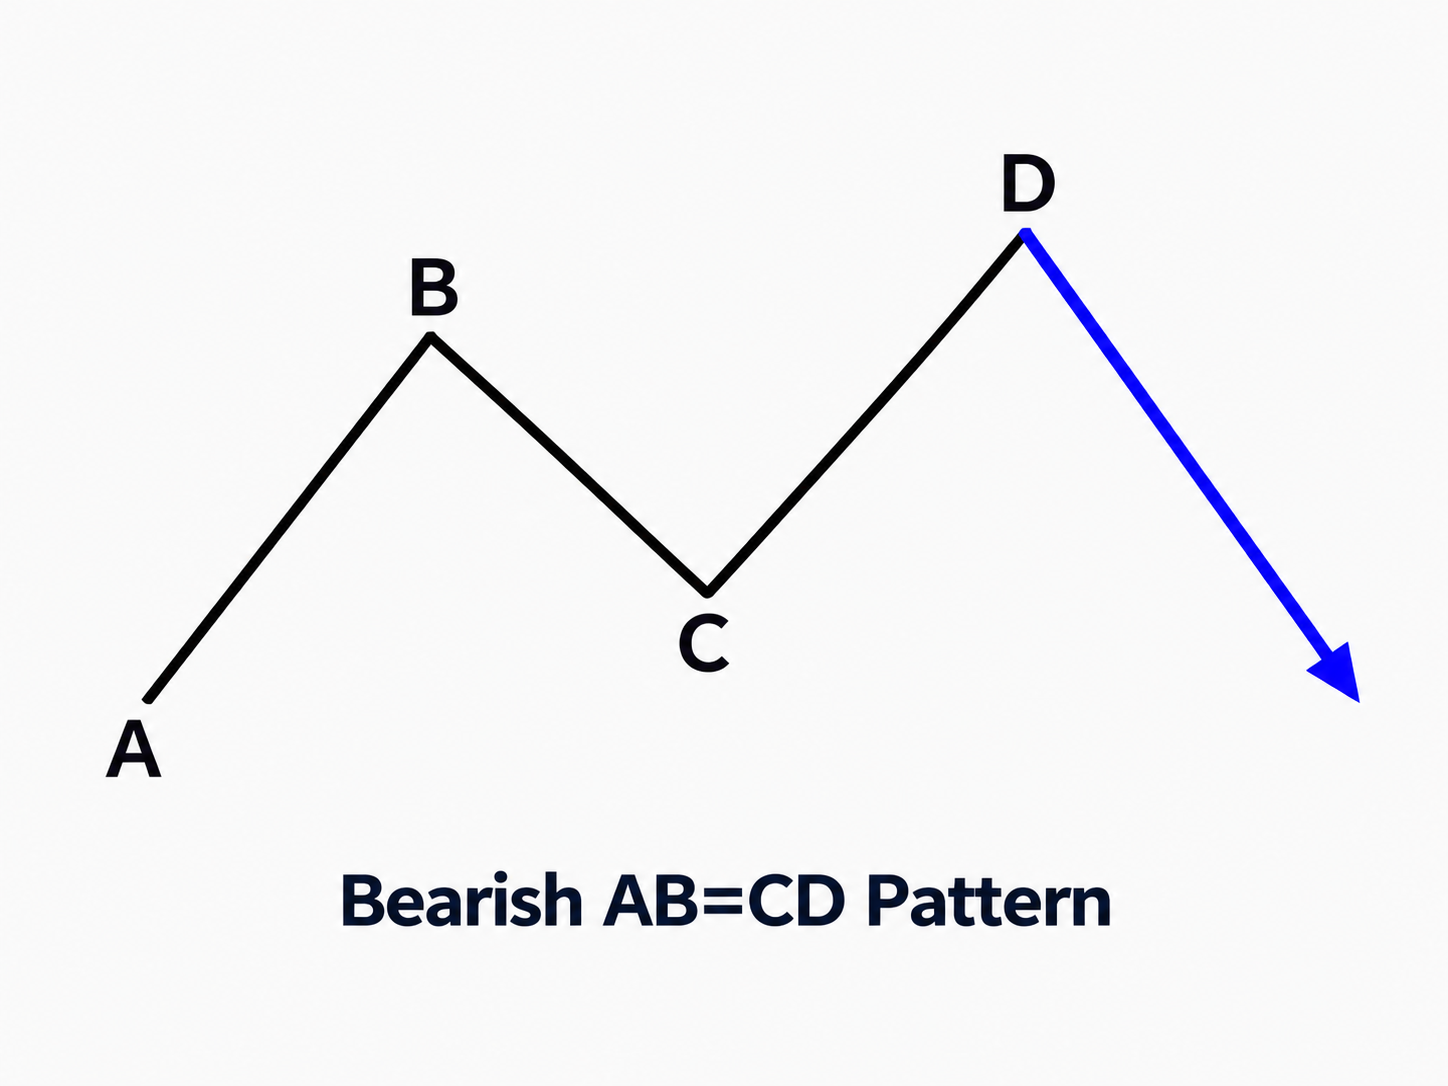
Bearish variation of the AB=CD pattern
In a bearish market, the AB=CD pattern represents an inverted version of the bullish formation.
It begins with segment AB (an upward price movement), followed by a bearish correction (segment BC). Another bullish movement then develops (segment CD), exceeding the previous high reached at point B.
When this pattern appears, traders should anticipate the beginning of a new bearish trend.
Bullish AB=CD Pattern
Let's examine some common examples of using the AB=CD pattern in a bullish market.
The chart below also includes the EMA (Exponential Moving Average) indicator. Although this indicator is optional, it makes identifying the direction of the primary trend easier.
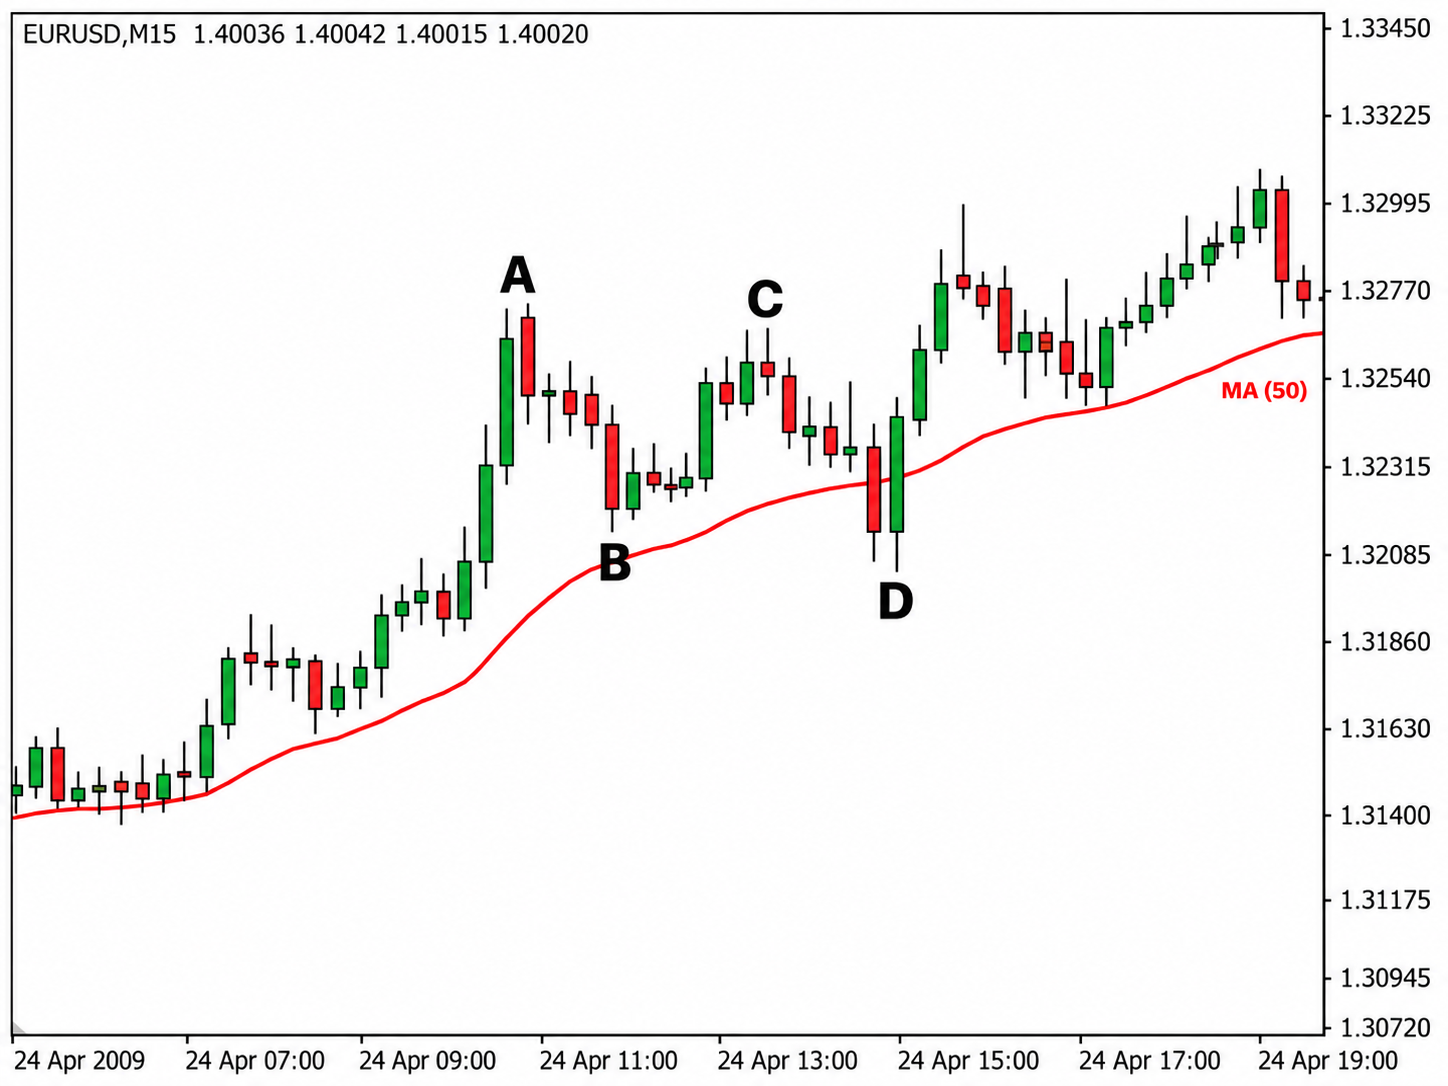
Chart explanation:
The price reaches a high at point A.
The first low is reached at point B.
A second high is formed at point C.
The second low is reached at point D.
The price continues moving in the direction of the main trend.
Example 1
A trader who is currently out of the market is waiting for a reversal during an upward trend, hoping to enter the new movement as early as possible.
The trader anticipates a reversal because the price fails to break above the high at point A and forms another high at point C. Since the first high remains unbroken, this is interpreted as a potential trend reversal signal.
When the price breaks below the low at point D, the trader opens a short position.
This is a very common scenario. Traders frequently wait for such a breakout before entering a short trade. Some enter immediately after the price fails to exceed the previous high.
Others wait for a breakout of the trendline connecting points B and C. It is also possible to enter a trade at a new low if you expect a strong bearish trend.
What happens in the end?
The bears fail to reverse the prevailing trend.
For example, a major market participant may begin accumulating a large buying position at point D, reversing the price movement back in the direction of the original trend. This is indicated by a strong bullish candlestick.
Stop-loss orders are also positioned above point C, where large market participants may trigger them.
A bearish trader's stop-loss is effectively a buy order. Therefore, when these stops are triggered, buying volume increases, helping push the price higher.
Example 2
Suppose a trader has already entered a bullish trend.
After noticing a price decline around point C, the trader predicts a possible trend reversal and places a stop-loss order near the previous low below point B.
As a result, the trader's stop-loss is triggered at point D.
Afterward, the trader hopes to reenter the upward trend by opening a new long position. This can be done after a strong bullish candlestick appears.
The newly opened position adds to buying pressure, helping the price rise with renewed strength.
Thus, the AB=CD pattern often becomes a trap for both bulls and bears, triggering their stop-loss orders. As a result, traders on both sides may unintentionally strengthen the price movement against their original positions.
Bearish AB=CD Pattern
Let's examine how the pattern can be used during a clearly defined bearish trend.
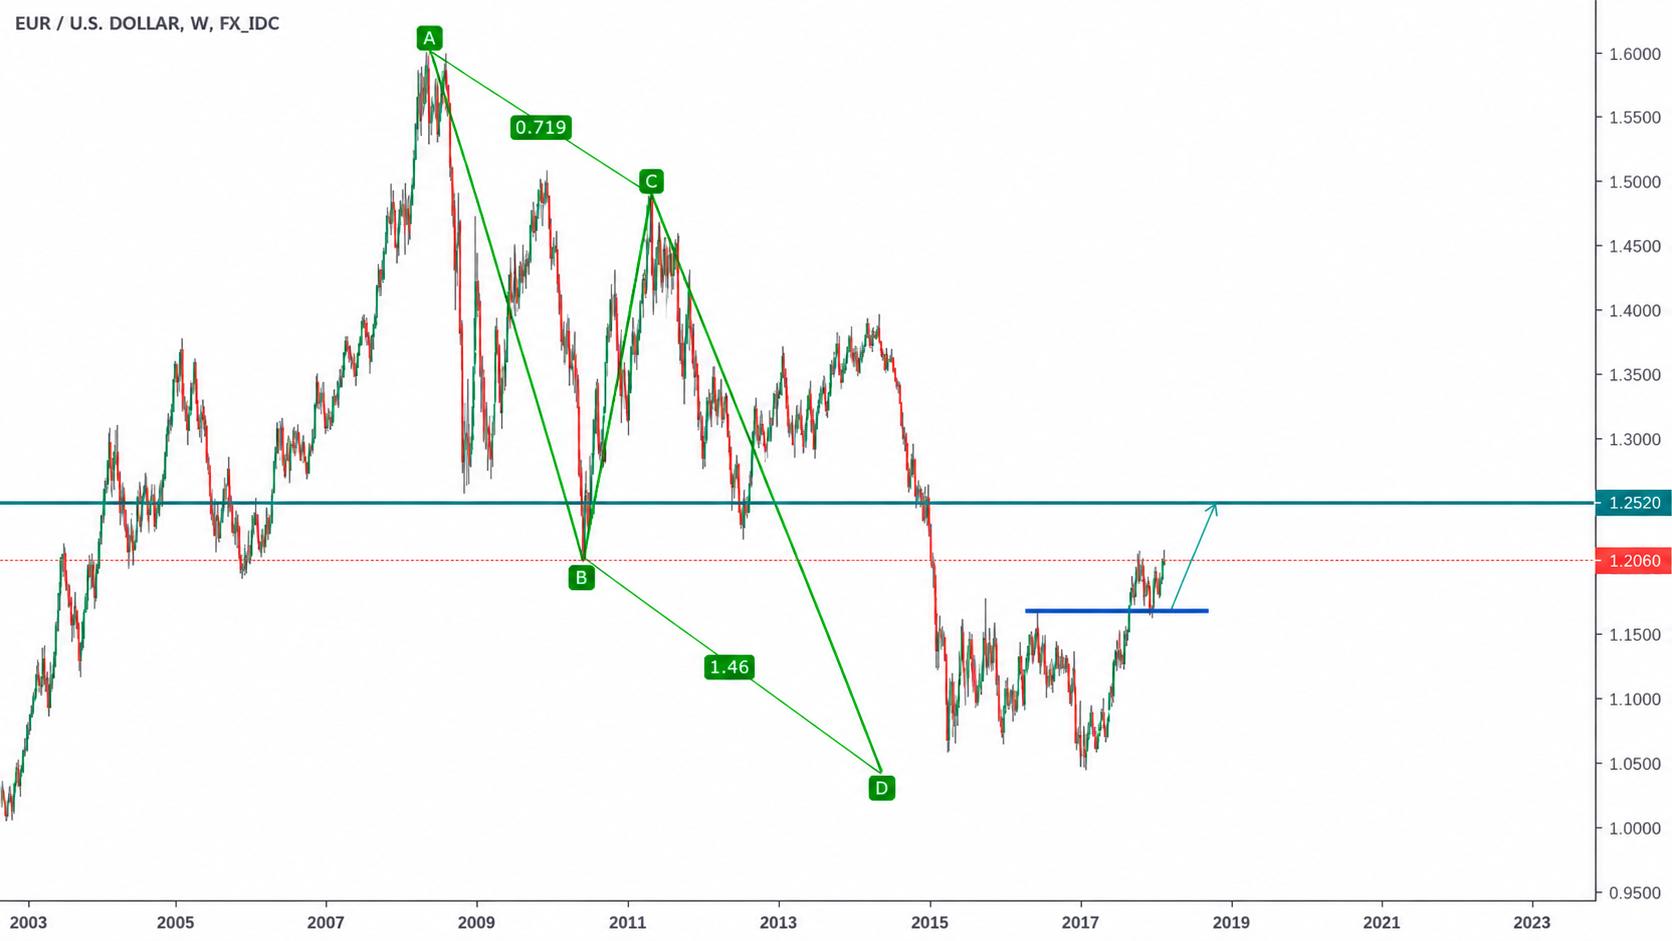
Chart explanation:
A new low is established at point A.
The first high is reached at point B.
A second low is formed at point C.
A second high is reached at point D.
The price pulls back and returns to the downward trend.
At point B, the asset's price begins to pull back downward, encouraging traders to open short positions because they can place relatively tight stop-loss orders just above the candlestick.
These stop-loss orders are triggered when the price reaches point D, completing the bear trap.
The price then begins to decline, trapping traders who decided to open long positions following the breakout above the previous high at point D.
As a result, both bulls and bears fall into a trap once again, while the market continues moving downward.
To avoid finding yourself in such a situation, remember that an established trend is generally more likely to continue than to reverse.
How to Trade Binary Options Using the AB=CD Pattern
Options should be purchased after the AB=CD pattern begins to form.
Four points (A, B, C, and D) and two initial segments (AB and BC) should appear on the price chart. Once the price reaches point D, the pattern is fully formed.
The pattern is likely to repeat after a price retracement.
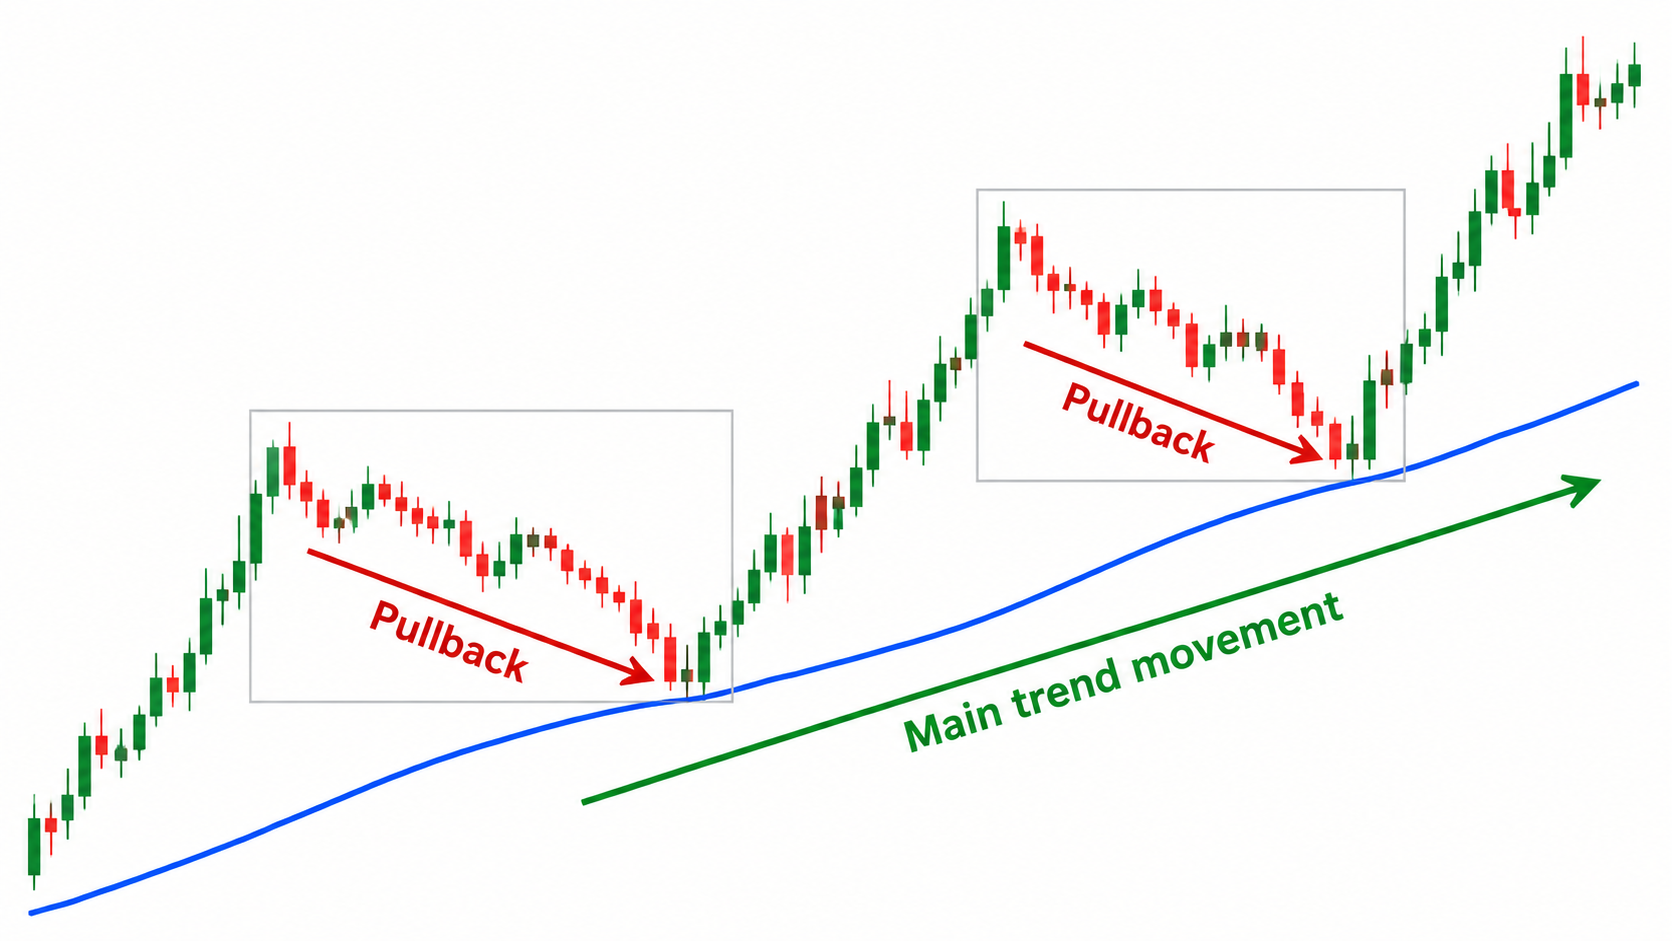
Price retracements followed by a return to the main trend
The AB=CD pattern begins with a strong upward price movement.
Bulls actively purchase the asset starting at point A, gradually pushing its price to new highs throughout the trading day until it reaches point B.
At point B, traders who purchased the asset earlier begin selling their positions to lock in profits. As a result, the price starts to decline.
Considering these conditions, you can purchase a DOWN (PUT) option when the underlying asset's price approaches point B in a bearish market.
If you identify a price level below which the asset no longer declines (point C), this indicates a potential support level.
In this case, you should consider purchasing an UP (CALL) option before the price reaches the support level.
In addition to standard binary options, the AB=CD pattern can also be used with other types of contracts.
For example, you can purchase a One Touch option, with the target price level determined by point D.
Key Takeaways
Chart Patterns – combinations of price movements, trading volumes, graphical formations, and technical indicators used to predict the future direction of an asset's price.
Harmonic Patterns – geometric formations on currency pair charts whose elements are connected by specific mathematical relationships.
Retracement (Pullback) – a short-term price movement against the prevailing trend, followed by a return to the original trend direction.