




Binary Options Trading with the Flag Pattern | Effective Trading Strategy
How to Trade Binary Options Using the Flag Pattern
The Flag is one of the classic patterns in technical analysis. It is widely used not only in binary options trading but also in many other types of financial trading. This pattern helps traders determine whether an underlying asset is likely to continue moving in the direction of an established trend.
Today, we will take a detailed look at the characteristics of the Flag pattern. You will learn about its advantages and disadvantages. This article also provides examples of how to successfully apply the Flag pattern to binary options trading under different market conditions.
In This Article, You Will Learn:
How Does the Flag Pattern Work?
The Flag Pattern in a Bullish Market
The Flag Pattern in a Bearish Market
How to Trade Binary Options Using the Flag Pattern
How Does the Flag Pattern Work?
The Flag is a trend continuation pattern. It allows traders to identify favorable opportunities to enter the market in the middle of an established trend. A Flag appears when prices are moving strongly in one direction (upward or downward) but then suddenly pause.
The asset's price begins to consolidate within a sideways trading range, sometimes moving against the prevailing trend. As a result, two trendlines appear on the chart—one at the top and another at the bottom of the range—forming a rectangular shape. Visually, this chart formation resembles a flag.
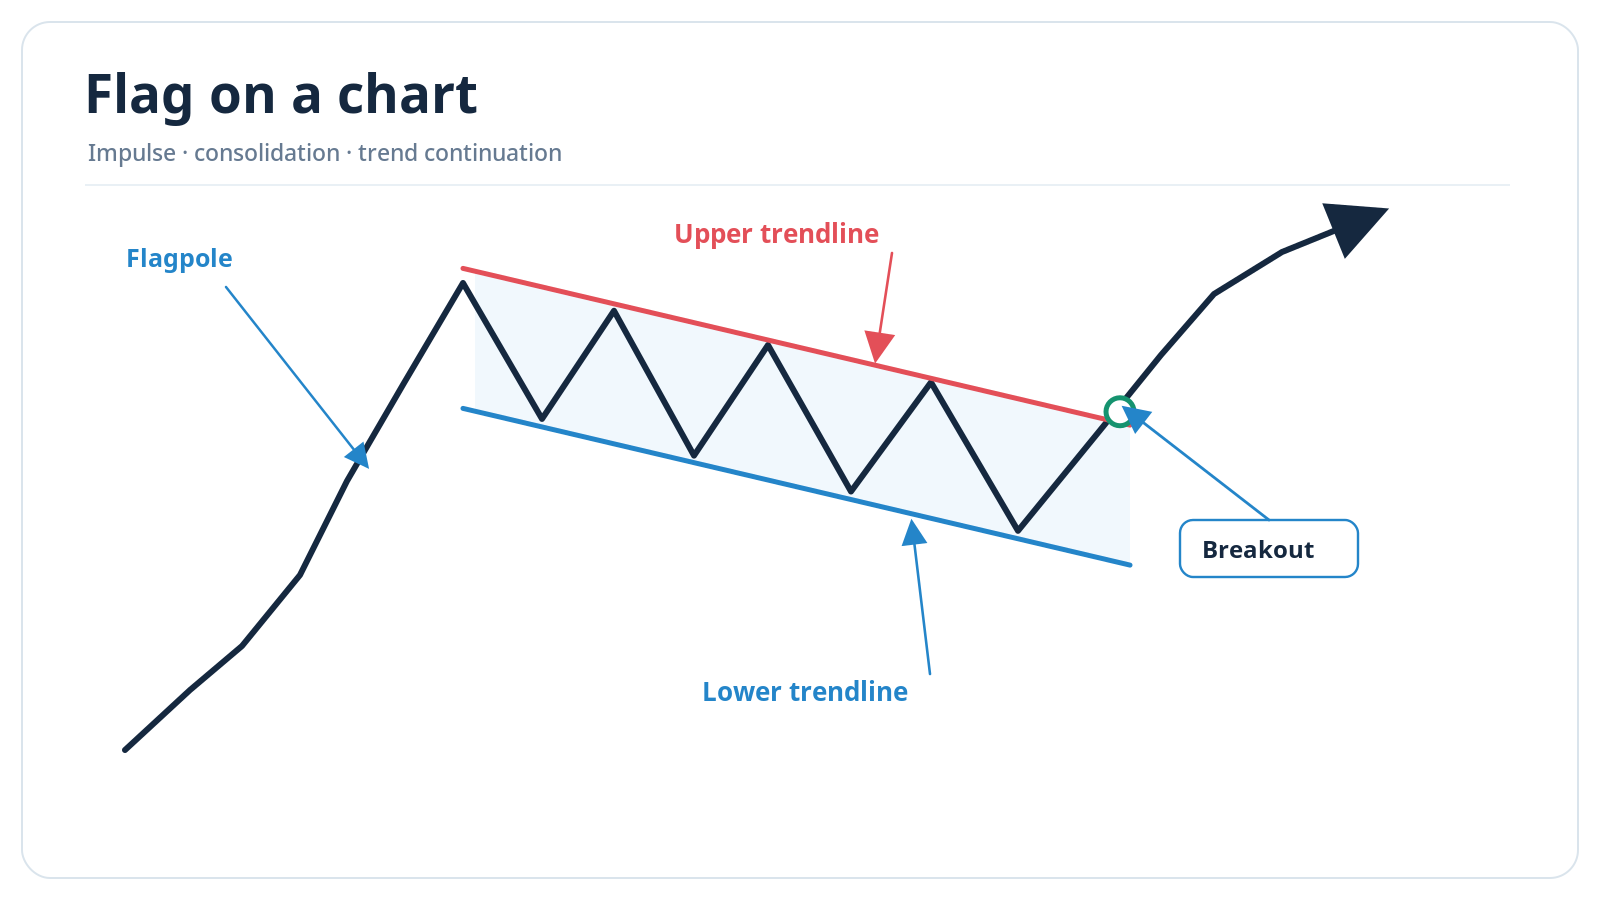
Flag pattern on a chart
Eventually, the asset's price breaks out of the Flag pattern and continues moving in the direction of the original trend, allowing traders to enter the market under favorable conditions.
Like most other technical analysis patterns, Flags can be either bullish or bearish.
The Flag Pattern in a Bullish Market
A Bullish Flag is a classic pattern indicating the continuation of an upward trend. Its defining characteristic is a short-term downward consolidation followed by a period of strong price appreciation.
The Flag resembles a rectangle that gradually narrows, reflecting declining trading volume. Its formation indicates that market participants are looking to take profits on their existing positions. This creates a favorable entry opportunity for traders, as the narrowing consolidation is typically followed by a strong breakout above the pattern's upper boundary.
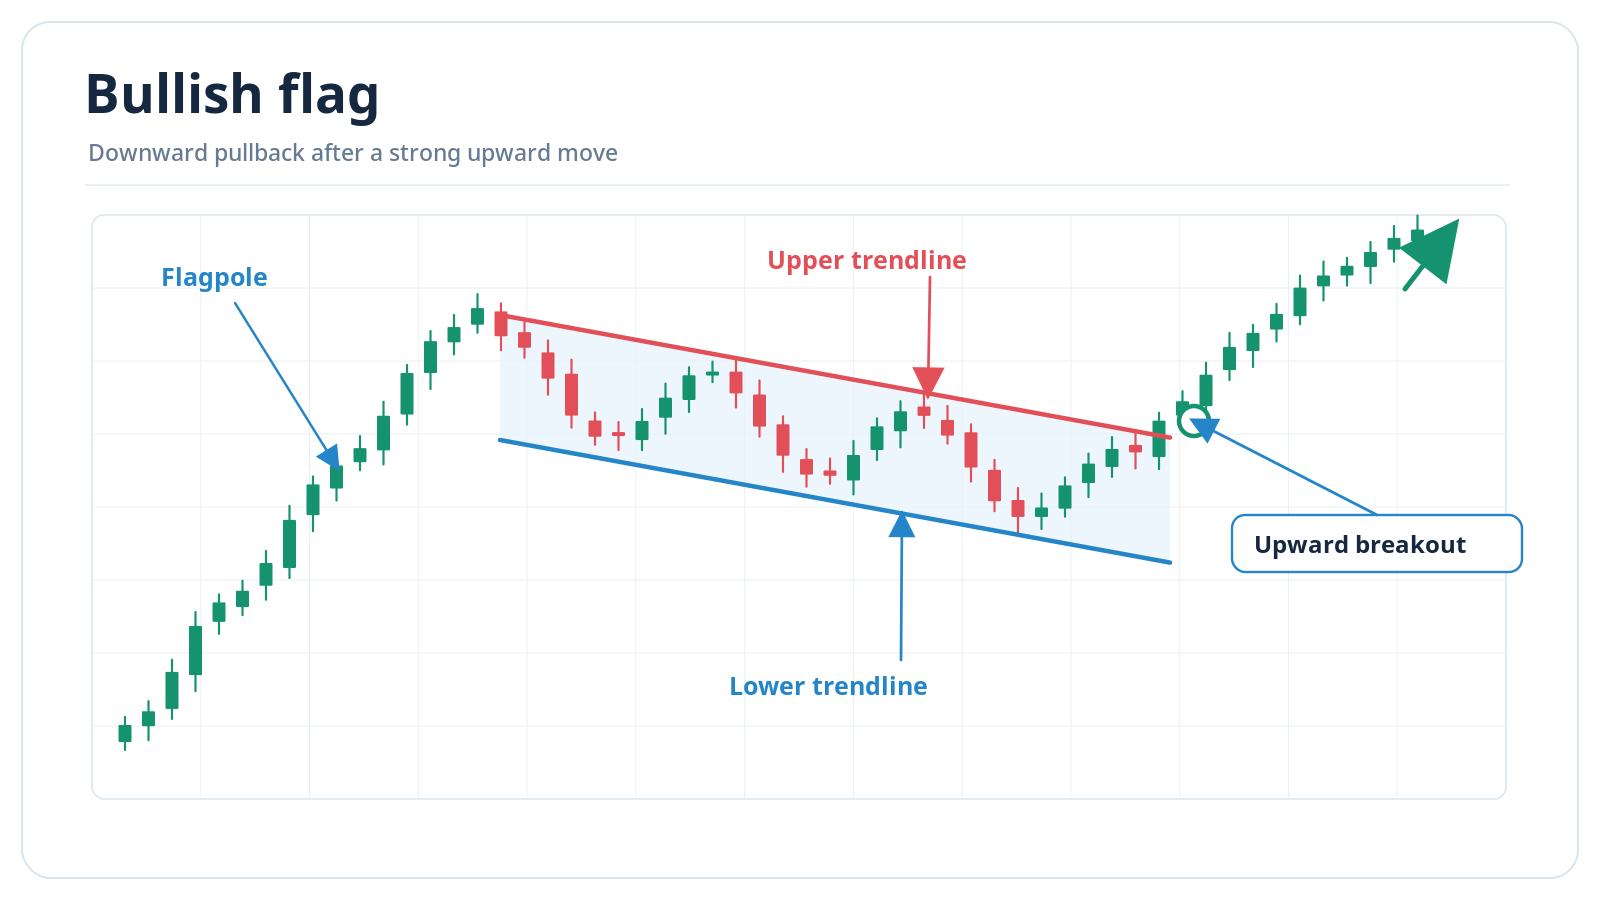
Bullish Flag pattern
The price initially moves within an upward trend before entering a downward-sloping rectangular channel.
The price then breaks out of this channel, and the upward trend resumes.
Advantages and Disadvantages of the Bullish Flag
When analyzing a Bullish Flag, traders need to consider several important factors. Let's examine the main advantages and disadvantages of using this pattern.
Advantages:
The pattern is difficult to confuse with other chart formations, making it easy to identify even for beginners.
It provides a quick way to find an entry point when the price breaks out of the rectangular consolidation. The exit point can also be easily estimated based on the length of the flagpole.
The Flag is a common chart pattern that you will encounter frequently when trading binary options.
Disadvantages:
On shorter timeframes, the Flag pattern can sometimes produce false breakouts.
After the flagpole forms, the price enters a downward consolidation phase. The duration of this consolidation depends on the selected timeframe, meaning the pattern may take several weeks to complete.
How to Identify a Bullish Flag
To accurately identify a Bullish Flag, you need to evaluate several factors when analyzing the price chart.
The pattern should meet the following criteria:
First, a strong bullish price movement occurs, forming the flagpole.
Next, a downward consolidation develops, creating the Flag itself.
The asset's price temporarily declines, but the correction usually does not exceed 30%.
A trade should only be opened after a candlestick has fully closed outside the Flag pattern.
The Flag Pattern in a Bearish Market
A Bearish Flag is the exact opposite of a Bullish Flag. It indicates the continuation of a downward trend. This pattern is relatively easy to recognize because the price temporarily moves against the original trend. An upward consolidation develops, after which the asset's price is expected to resume its decline.
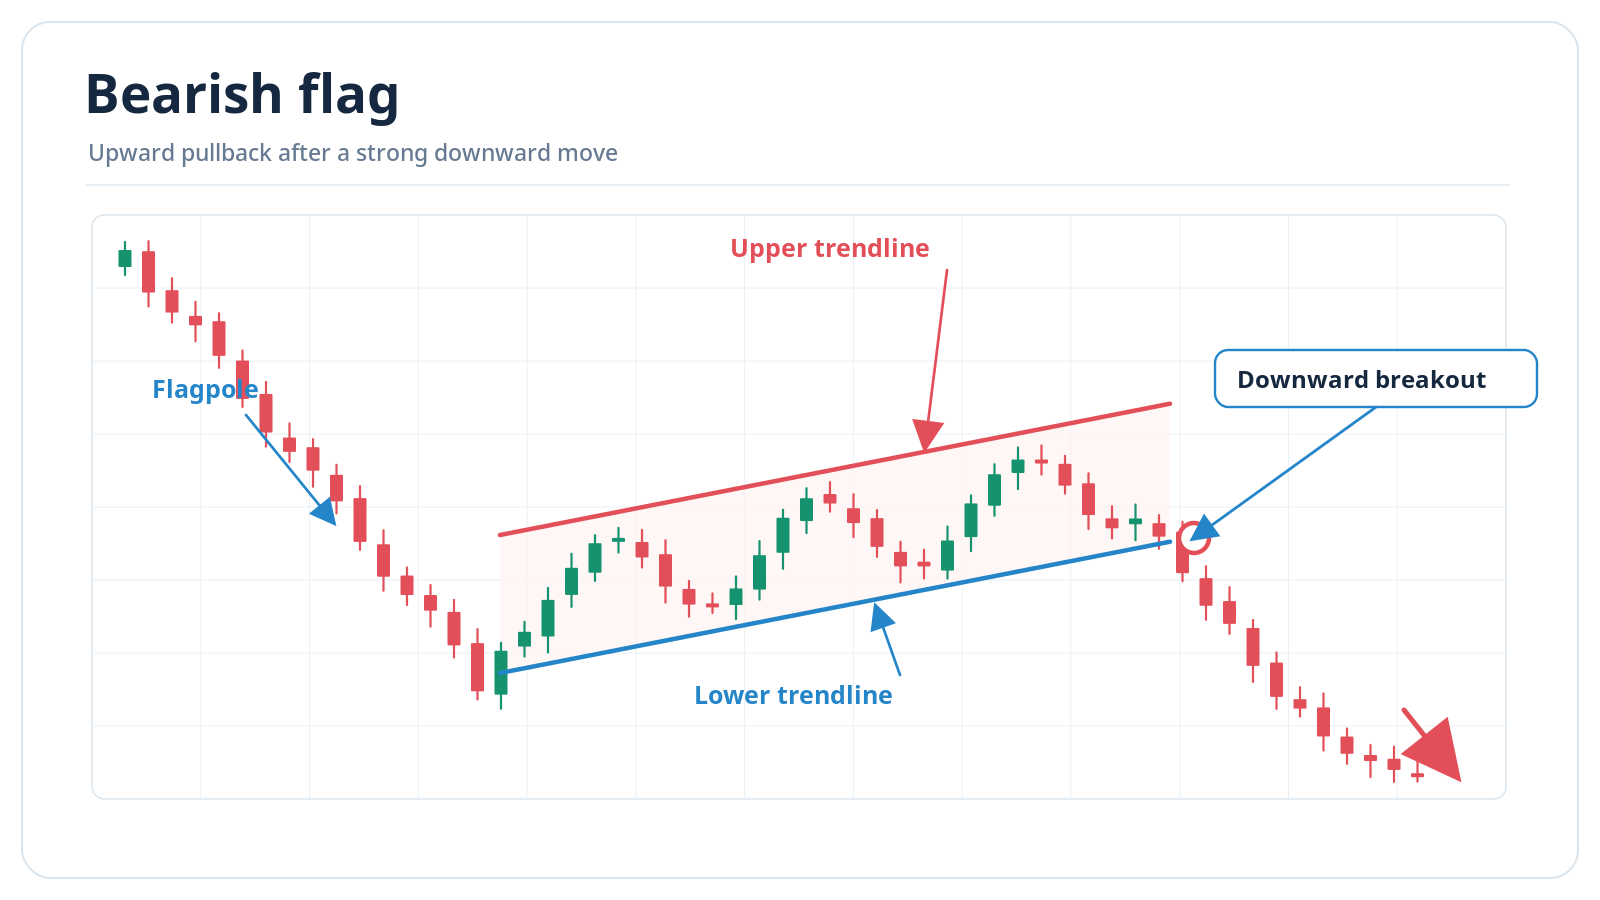
Bearish Flag pattern
This type of Flag is less common. You may encounter it when the underlying asset is experiencing a sustained decline in value. Increasing trading volume serves as confirmation of the pattern.
After a significant price decline, a brief upward consolidation phase occurs, followed by a sharp breakout below the Flag. You will typically notice a strong red candlestick. The subsequent downward movement may either slow down or accelerate. A rapid decline can also occur following negative news.
Caution: A prolonged consolidation indicates that the Bearish Flag pattern may no longer be valid. In this situation, you should look for another trading pattern.
Advantages and Disadvantages of the Bearish Flag
Like other technical analysis patterns, the Bearish Flag has both advantages and disadvantages.
Advantages:
The pattern can be used with a wide variety of underlying assets and across different trading timeframes.
It offers a highly favorable risk-to-reward ratio.
If the pattern is identified correctly, the underlying asset is expected to continue declining in value.
The pattern occurs relatively frequently in financial markets.
Disadvantages:
Incorrectly identifying the pattern can lead to confusion and financial losses. Make sure the price correction does not exceed 30%. If the correction exceeds 45%, it may indicate a trend reversal rather than a continuation pattern.
Beginners often make mistakes when attempting to identify this pattern.
How to Identify a Bearish Flag
To identify a Bearish Flag with a high degree of accuracy, follow these guidelines:
Make sure there is a clearly defined bearish trend, meaning the underlying asset's price is declining.
Identify the flagpole formed by the initial sharp price decrease.
After the asset's price breaks through a support level, the downward movement slows and temporarily reverses upward, beginning the consolidation phase. This is followed by another reversal and an accelerated price decline.
Once the downward trend resumes, traders can identify suitable entry points.
How to Trade Binary Options Using the Flag Pattern
As you already know, the Flag is a versatile chart pattern that can be successfully applied under various market conditions. Let's examine effective trading strategies using this pattern for the most popular types of binary options.
Keep in mind that these strategies use the standard Momentum indicator alongside the Flag pattern. This indicator is available on Pocket Option and other trading platforms.
The Momentum indicator measures the rate of change in the price of an underlying asset over a specified period. When the indicator's value increases and crosses its centerline, it can signal the presence of an upward trend.
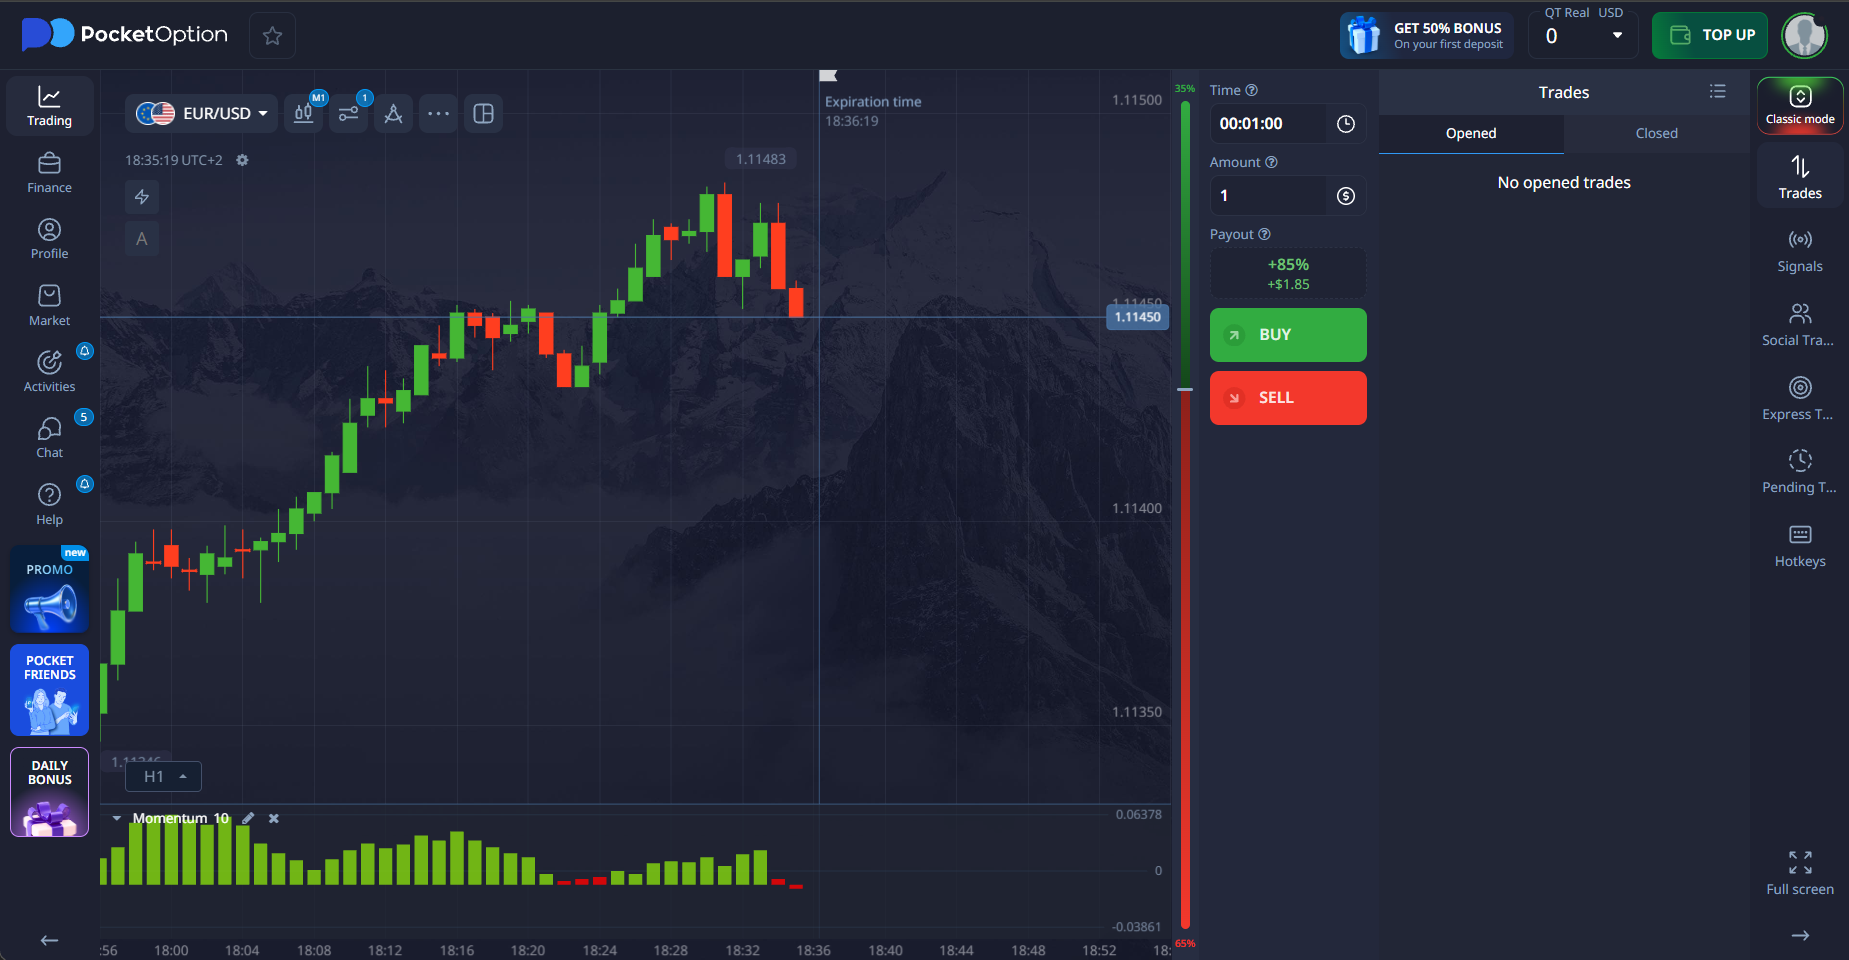
Momentum indicator on the Pocket Option platform
Trading 60-Second / 30-Minute / 60-Minute Options
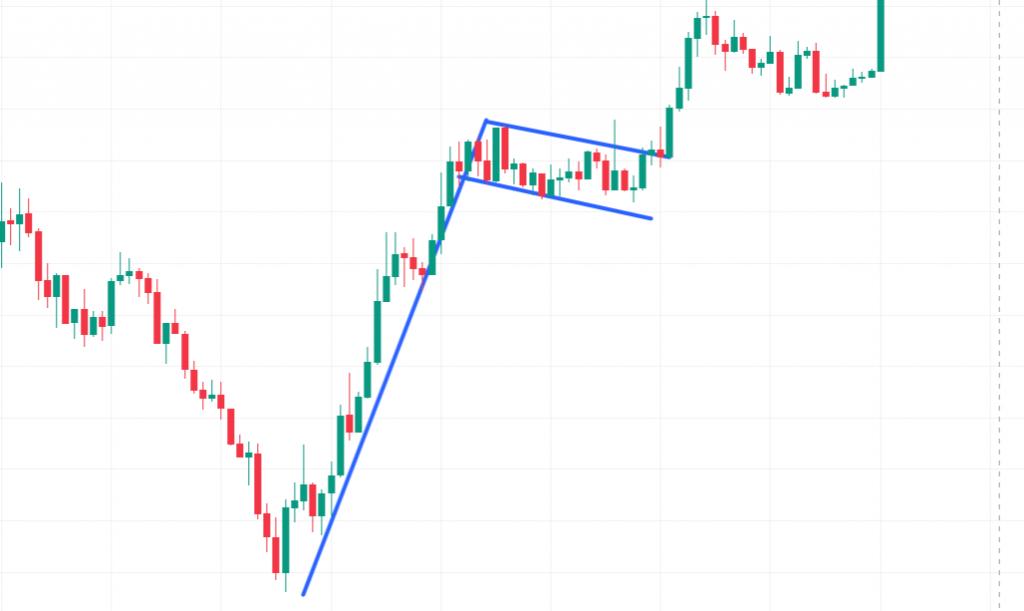
Example of a Flag pattern on a price chart (see the upper and lower trendlines)
You can purchase a CALL option with an expiration period of 60 seconds, 30 minutes, or 60 minutes after the price breaks above the upper trendline of the Flag pattern.
Trading volume should be increasing at the same time. The Momentum indicator should also be rising, maintaining bullish momentum.
The underlying asset is expected to continue appreciating as long as Momentum and trading volume support the upward movement.
Be prepared: the asset's price may rise sharply immediately after breaking above the upper trendline. You should purchase the appropriate option without delay when this breakout occurs.
Caution: A price pullback triggered by negative news may push the asset's price back below the upper trendline, causing the option to expire at a loss.
Trading One Touch Options
A One Touch option should be purchased when your projected price target, which can be calculated using the length of the flagpole, is equal to or higher than the target level offered by your broker.
Before entering a trade, make sure that both trading volume and Momentum are increasing.
The binary option may result in a loss if a sudden trend reversal occurs due to unexpected news.
Trading Double One Touch Options
Consider purchasing a Double One Touch contract only when major news concerning the underlying asset is expected.
If the news is positive, the asset's price is likely to continue rising and reach the upper target level specified by the broker.
Conversely, negative news may trigger a trend reversal, causing the price to fall below the lower target level.
Trading volume and Momentum should increase during the breakout above the upper trendline.
You should also pay attention to the projected price target. It should be comparable to the upper target level offered by the broker.
Caution: A binary option will expire at a loss if the news causes the market to enter a sideways trading range without reaching either target.
Trading No Touch Options
A No Touch contract is considered the best option for trading the Bullish Flag pattern.
You can purchase this type of contract when the price breaks above the upper trendline of the Flag.
As long as Momentum remains strong and trading volume is significantly elevated during the breakout, the probability of the price reversing below the upper trendline is considered extremely low.
Only unexpected negative news is likely to result in losses.
Since No Touch options do not require the price to reach a specific target level, you do not need to analyze the length of the flagpole.
Key Takeaways
Flag – a trend continuation pattern used in technical analysis.
Flat Market (Sideways Market) – a market condition in which prices move without a clearly defined upward or downward direction.
Consolidation – a period of relatively minor price fluctuations following a significant trending movement.
Momentum – the rate at which an asset's price changes over a specified period.