




The Pennant Trading Strategy for Binary Options
The indicator-free Pennant strategy for binary options is based on support and resistance levels. It can be applied during periods when the market is not making significant upward or downward moves and prices are moving sideways.
In this article, we will explore how the Pennant pattern works in binary options trading. This trading strategy is incredibly easy to learn and does not require additional indicators, making it ideal for traders with limited experience.
In This Lesson, You Will Learn:
How does the Pennant pattern work?
The bullish pennant
The bearish pennant
Trading binary options with the Pennant strategy
How Does the Pennant Pattern Work?
The Pennant pattern is a chart formation that signals a continuation of the trend.
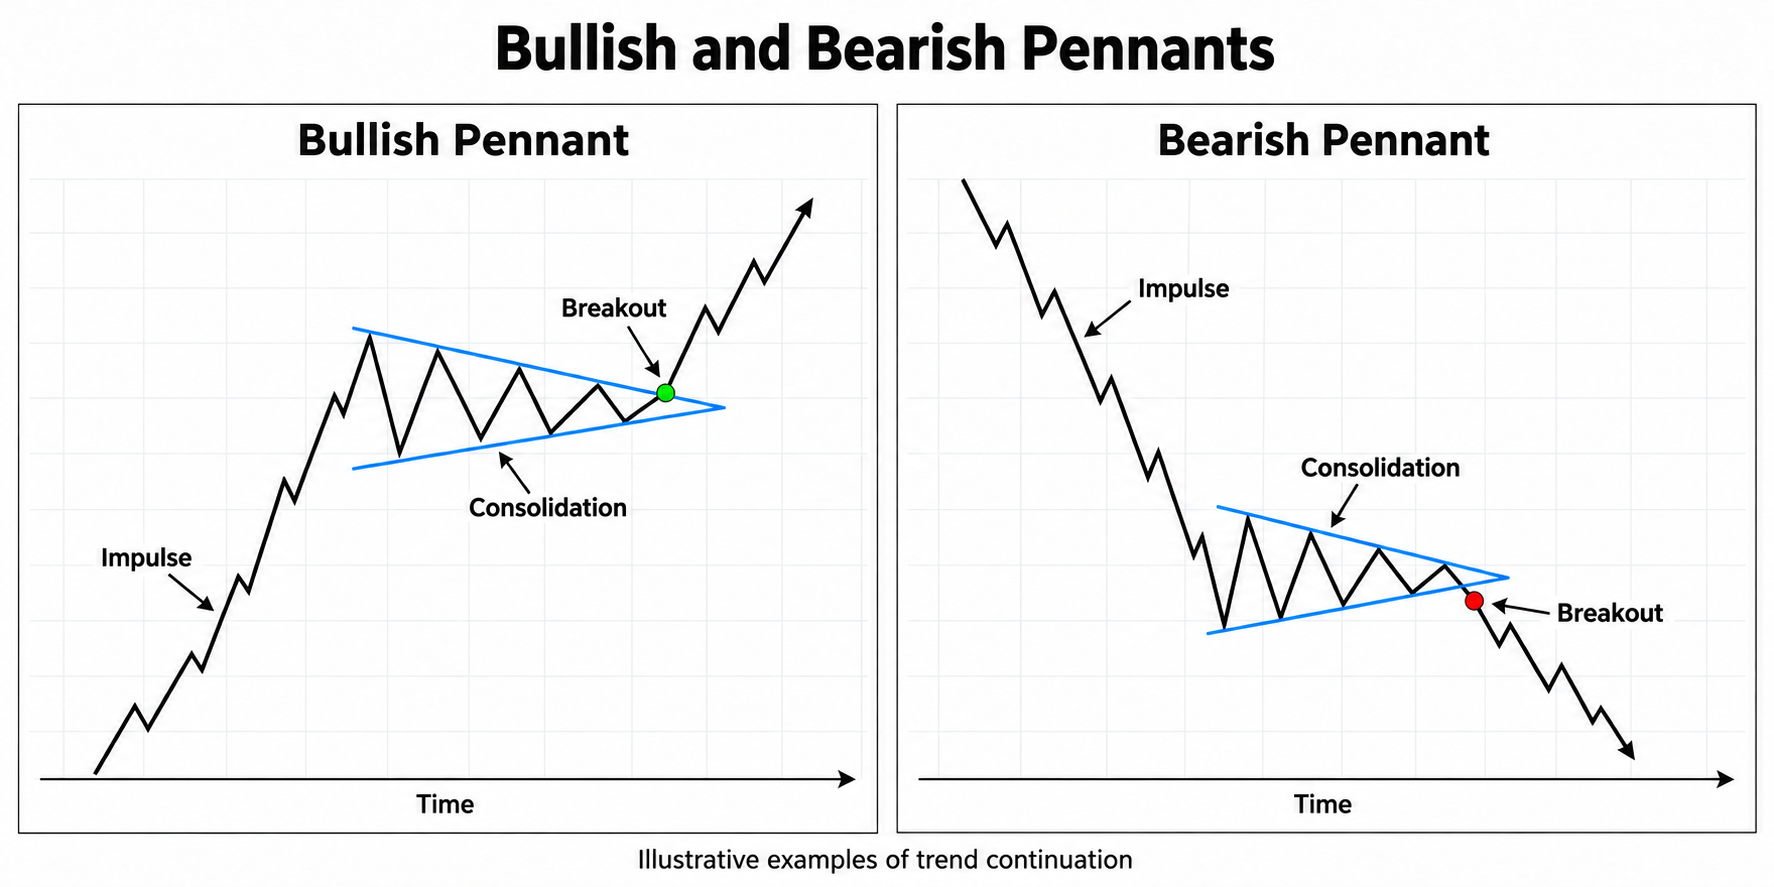
Bullish and bearish pennants
The pattern is characterized by a sharp price move followed by a consolidation phase within a narrowing triangle. This is accompanied by a decline in trading volume for the underlying asset. Once the range tightens, the price moves in the same direction as the initial move, while trading volume increases. Thus, the trend continues after consolidation.
Pennants are most commonly identified on shorter timeframes, from M15 to H1. This pattern occurs much less frequently on longer timeframes.
Pennants can appear in both bullish and bearish markets.
The Bullish Pennant
A bullish pennant signals a continuation of an upward trend. The pattern forms after a sharp price increase to a certain level, followed by consolidation and declining trading volume. During this pause, the asset accumulates within converging support and resistance levels.
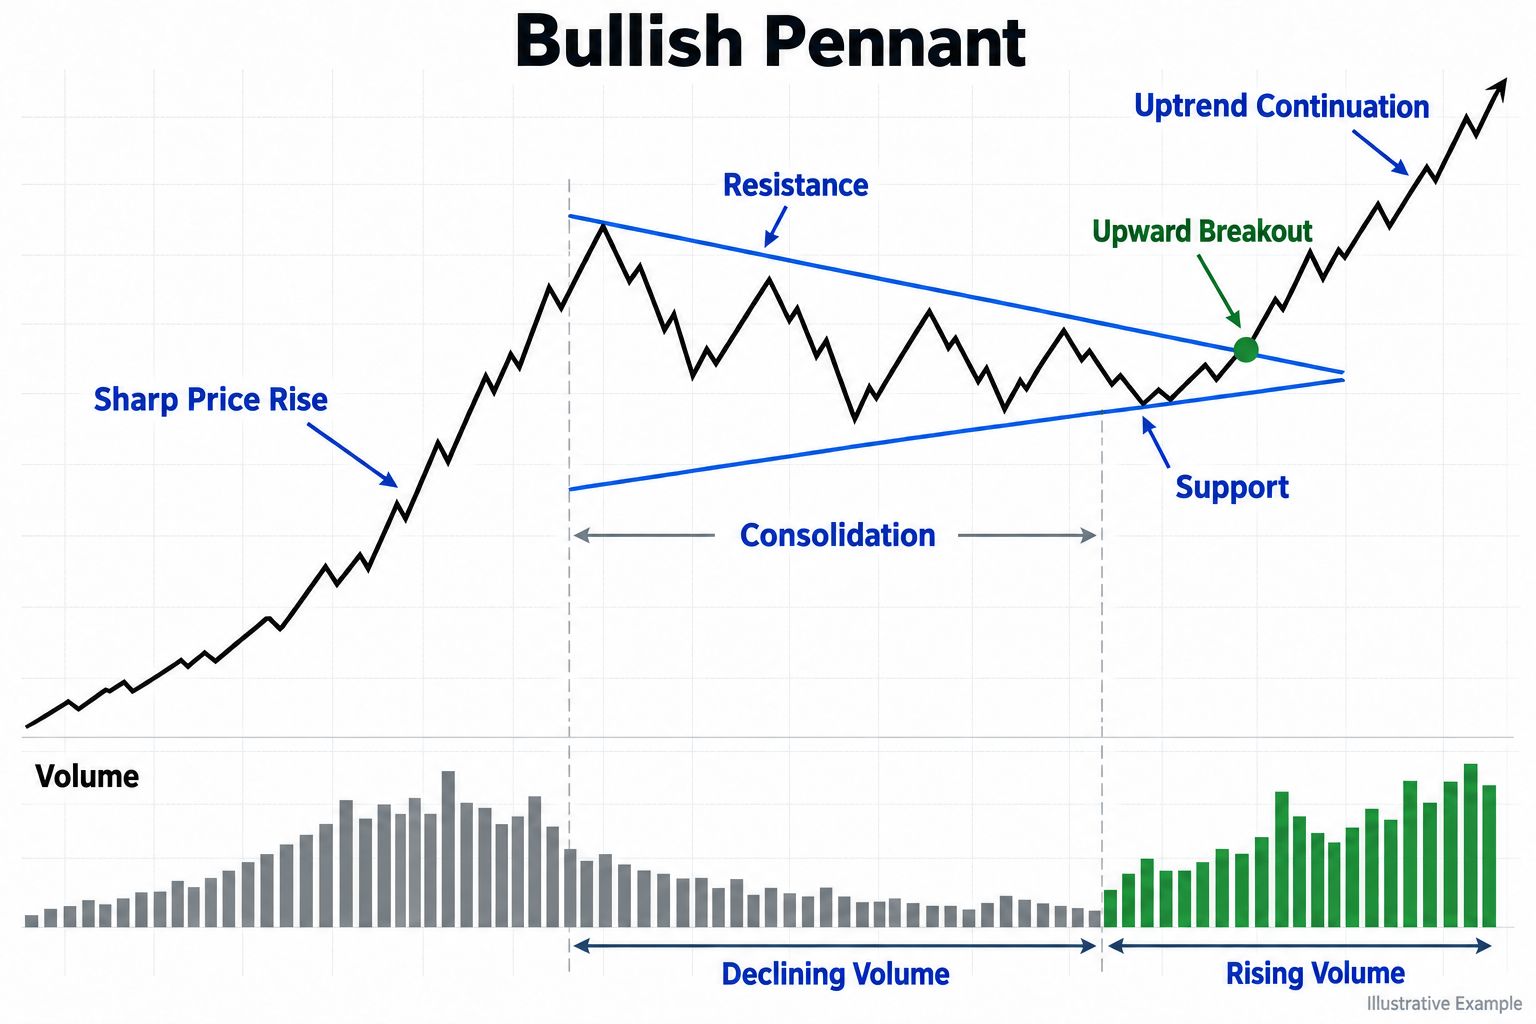
A bullish pennant
The trend is expected to resume immediately after the price breaks above the upper boundary, at the point where the two lines converge or slightly before it. Trading volume increases as the price rises by a distance equal to the height of the preceding impulse move or the pennant itself.
How to Identify a Bullish Pennant
Spotting a bullish pennant on a chart can sometimes be difficult, especially for beginners. The pattern can be confused with a flag or a triangle. Learn its defining characteristics to identify it accurately on a chart. You can practice spotting patterns with virtual funds using the simulator offered by Pocket Option or another trading platform.
Characteristics of a bullish pennant:
A sharp price increase precedes the pennant.
The pattern forms a symmetrical triangle bounded by support and resistance levels.
Trading volume declines as the pattern develops.
Trading volume increases sharply when the price breaks above the pattern’s upper boundary.
A pennant typically takes one to four weeks to form.
The Bearish Pennant
A bearish pennant is a continuation pattern that signals the resumption of a downward trend.
This formation develops after a decline in prices.
As with a bearish flag, sellers push the price down before a brief consolidation phase begins. Once the pattern is complete, the downward trend resumes.
A bearish pennant resembles a triangle with progressively higher lows and lower highs.
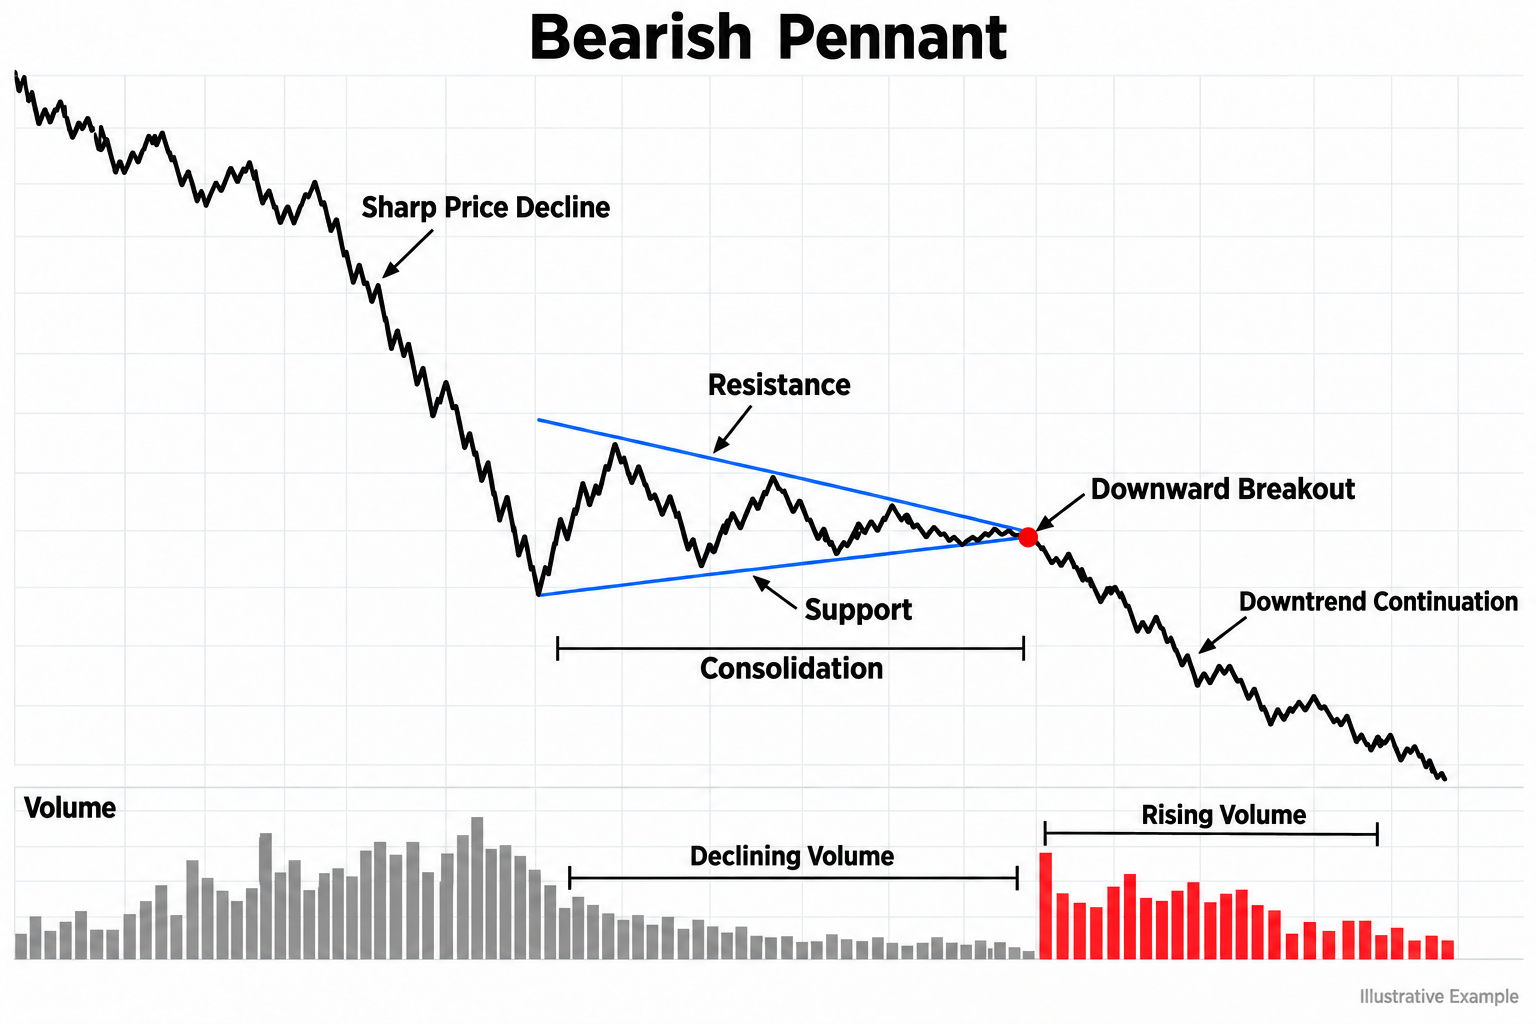
The price breaks below the pennant’s lower boundary and, supported by increasing volume, falls by a distance equal to the height of the pattern.
How to Identify a Bearish Pennant
Identifying a bearish pennant follows the same process as identifying a bullish one, but prices move in the opposite direction.
To spot the pattern, look for two features. First, there must be a significant upward move, known as the flagpole. Second, a consolidation phase must develop, forming a symmetrical triangle bounded by support and resistance levels.
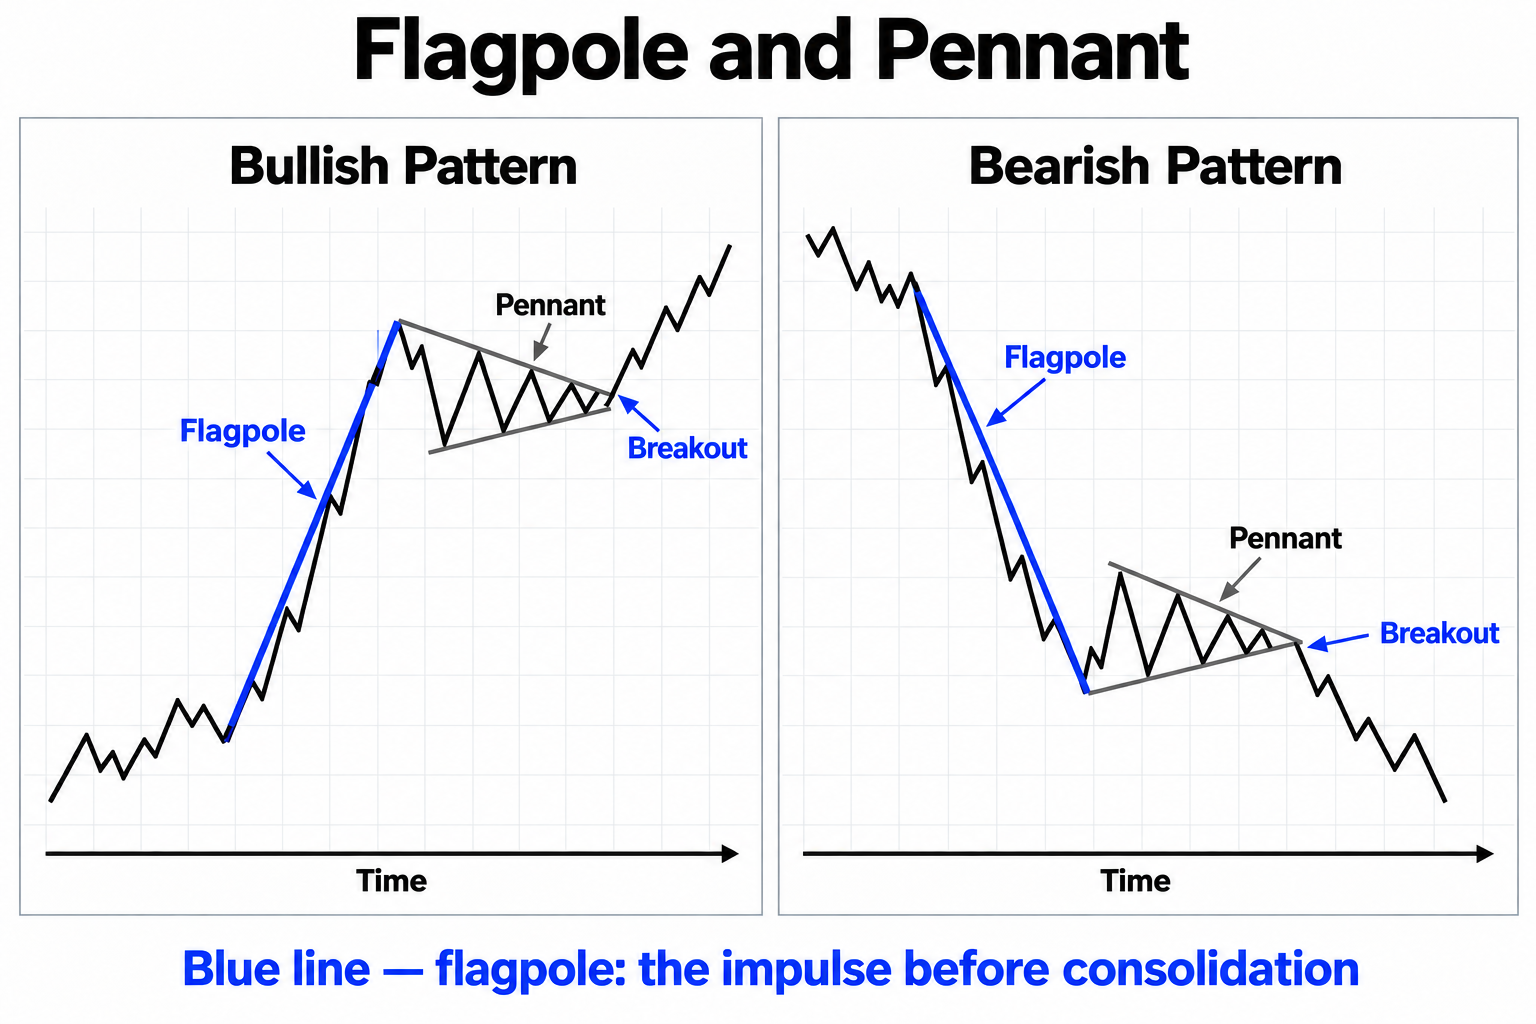
The blue line in the illustration is the flagpole.
How to distinguish a bullish pennant from similar patterns:
Unlike a triangle, a pennant is preceded by a significant upward move.
Unlike a wedge, its support and resistance lines do not both slope downward.
Unlike a bullish flag, its support and resistance lines form a triangle rather than running parallel to each other.
A bullish pennant is also accompanied by declining volume during price consolidation. Volume increases as soon as the market begins to break out of the pattern.
Trading Binary Options with the Pennant Strategy
The strategies described in this article use bullish pennants. You can apply the same approach to a bearish pattern when the price breaks below its lower boundary.
Trading 60-Second / 30-Minute / 60-Minute Options
When trading standard CALL contracts with 60-second / 30-minute / 60-minute expirations, you should act after the price breaks above the pennant’s upper trendline. Trading volume should increase at the same time.
The upward trend continues as long as volume and momentum reinforce each other. A reversal will occur only in response to unexpected news. In that case, the price will fall back below the pattern’s upper trendline after the breakout. If everything goes as planned, however, a strong upward move will follow the breakout, and the option will generate a profit.
Trading One Touch Options
Consider purchasing a One Touch CALL option when the projected price target, calculated using the pattern’s flagpole, is equal to or higher than the target set by the broker. Before entering the trade, make sure that trading volume is increasing significantly and momentum remains strong. Negative news can trigger a reversal, resulting in losses.
Trading Double One Touch Options
When important reports or news affecting the underlying asset are released, consider purchasing a Double One Touch contract. If the news is positive, the price will continue its upward trend and break through the upper target set by the broker. Negative news, meanwhile, will trigger a reversal and a subsequent break through the broker’s lower target.
If the news weakens momentum and causes price movement to slow, the Double One Touch option will result in a loss. Look for increasing volume as the price breaks above the pennant’s upper trendline. Also remember that the projected price target should be well above the upper target set by your broker.
Trading No Touch Options
A No Touch option works particularly well with a bullish pennant. Consider purchasing it after the price breaks above the upper, downward-sloping trendline. If trading volume remains high and momentum is strong enough, the probability of the price falling below the pennant’s upper boundary is minimal.
The option will result in a loss if unexpected negative news is announced. Since a No Touch contract does not require the price to cross a predetermined level, traders do not need to place as much emphasis on the projected price target calculated from the length of the flagpole.
Trading Double No Touch Options
Purchase a Double No Touch contract when both of the following conditions are met:
The price breaks above the pattern’s upper boundary, but momentum remains weak and trading volume does not increase.
No major financial news is expected before the option expires.
In the absence of news that could cause a sharp increase in volatility, neither of the price boundaries set by the broker will be breached, and the trade will generate a profit.
Summary
Price consolidation — a period during which prices move sideways without significant fluctuations.
Flagpole — the line formed by a strong price move in the direction of the prevailing trend before that move pauses.