




Three Ducks Strategy for Binary Options
The Three Ducks strategy is an accessible approach to binary options trading that is suitable even for beginners with no prior experience. This trading method is incredibly easy to implement and has the potential to deliver high returns.
Let's explore the key features of this unusually named trading strategy. We will explain why the Three Ducks strategy is considered so effective and when it can be applied. You will also learn exactly how to use this strategy for binary options trading.
In This Article, You Will Learn:
How Does the Three Ducks Strategy Work for Binary Options?
The Structure of the Three Ducks Strategy
How to Trade Binary Options Using the Three Ducks Strategy
How Does the Three Ducks Strategy Work for Binary Options?
The Three Ducks strategy is a trend-following trading method that allows traders to enter the market in the middle of an established trend—in other words, when prices are actively moving in a particular direction. It is used together with the SMA indicator, which is available on Pocket Option and several other trading platforms.
What Is the SMA (Simple Moving Average) Used For?
Moving Averages are among the most widely used technical indicators in trading. They smooth out price fluctuations to help identify the current market trend by displaying average price movements as a line on a chart. This indicator is an essential tool for analyzing price movements in many options trading strategies.
The Simple Moving Average (SMA) is the most basic type of moving average. It is calculated by finding the arithmetic mean of a specified number of price values. The formula is:
SMA = (Sum of Asset Prices Over X Periods) / X
For example, to calculate a 30-day moving average, you need to add up the closing prices for the previous 30 days and divide the total by 30. This value changes every day as new price data becomes available, which is why the indicator is called a moving average.
A moving average with a shorter calculation period responds more quickly to price changes. Indicators with short periods are called fast moving averages. Conversely, the longer the calculation period, the slower the indicator reacts to minor price fluctuations. An indicator with a longer period is called a slow moving average.
The Simple Moving Average is calculated by averaging prices over a specified number of periods. Its main disadvantage is that it responds relatively slowly to sudden price changes, which frequently occur near market reversal points.
What Do Ducks Have to Do with Binary Options?
The name Three Ducks comes from the American idiom "get your ducks in a row," which means to get everything organized and properly arranged.
You have probably seen a family of ducks swimming together in a line, one following another. This is where the trading strategy gets its name. Three trading conditions across different timeframes must line up in sequence, just like ducks swimming in formation, to identify potentially profitable trading opportunities.
The strategy is very simple: traders only need to follow a specific set of instructions. However, it is not limited to beginners, as experienced traders also use it due to its effectiveness. In some situations, the Three Ducks strategy can help minimize risks when trading binary options.
The Structure of the Three Ducks Strategy
The strategy involves analyzing price movements across three different timeframes: M5, H1, and H4. As you already know, the Three Ducks strategy uses the Simple Moving Average (SMA) indicator with a period of 60. This indicator is available on the Pocket Option trading platform.
First, let's examine how this strategy works in the Forex market, using currency pairs rather than binary options as an example.
Each of the three conditions is called a "duck." All three ducks must swim in the same direction, meaning that the price should remain below the SMA on all three timeframes in a bearish setup.
First Duck
First, analyze the H4 timeframe (4-hour chart). Make sure that the asset's price is below the SMA 60 moving average. If this condition is met, proceed to the second step.
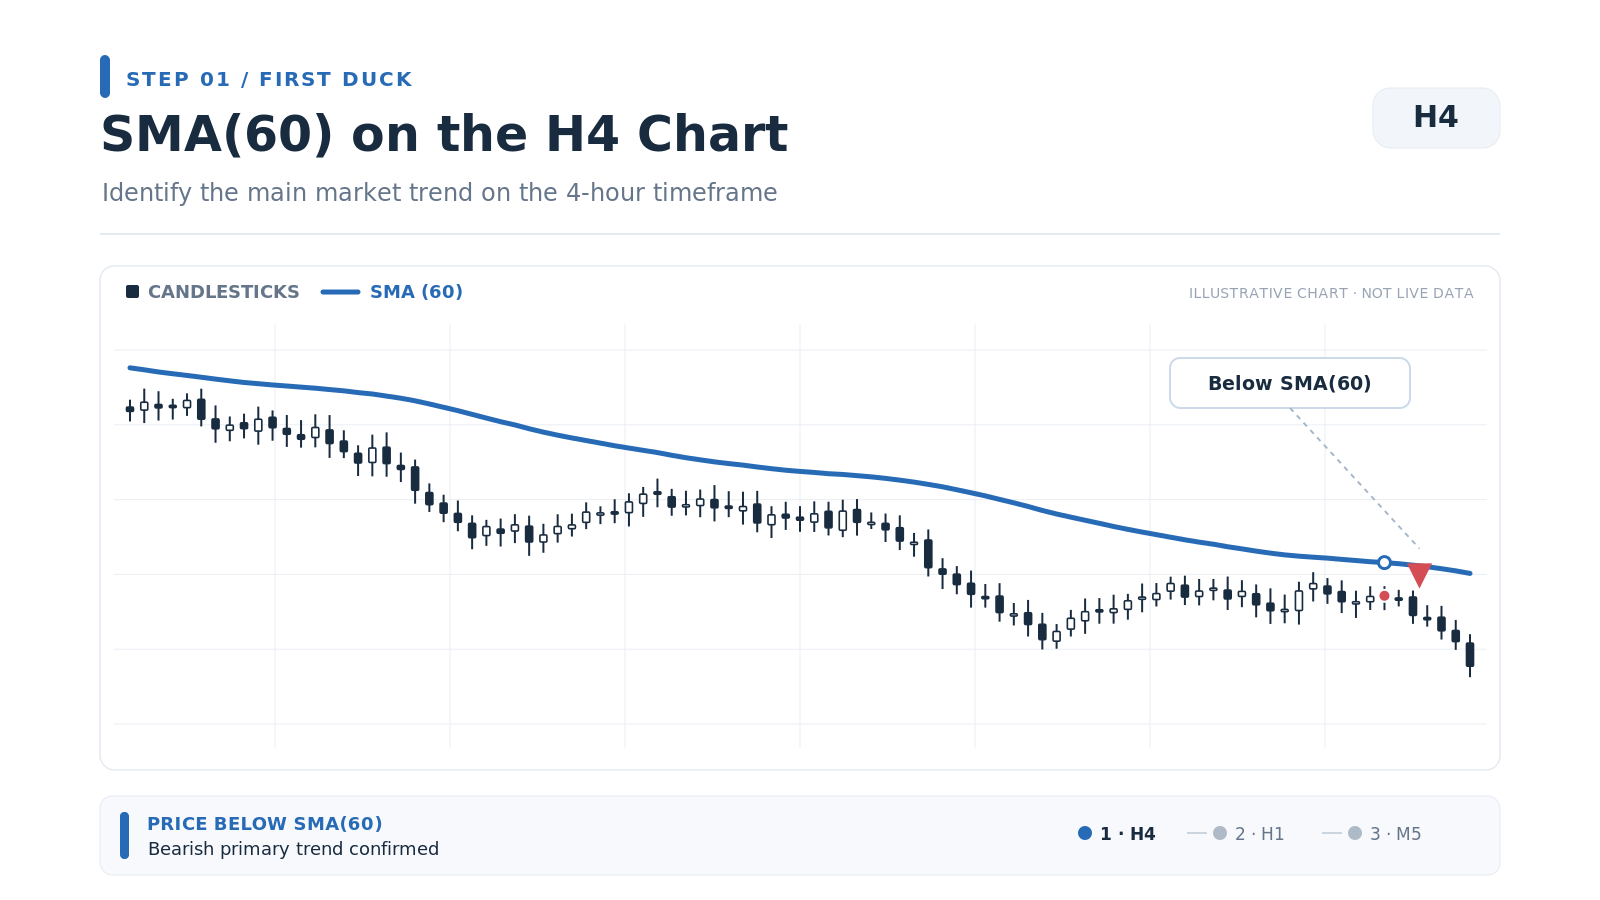
SMA on the H4 timeframe
Second Duck
The second step of the Three Ducks strategy involves analyzing the hourly chart. As in the previous step, you need to make sure that the price is below the SMA 60 moving average.
If the price of the selected trading instrument is above the moving average, wait until it crosses the SMA from above to below.
Only after this condition is met should you proceed to the third step, where you will decide whether to open a trade.
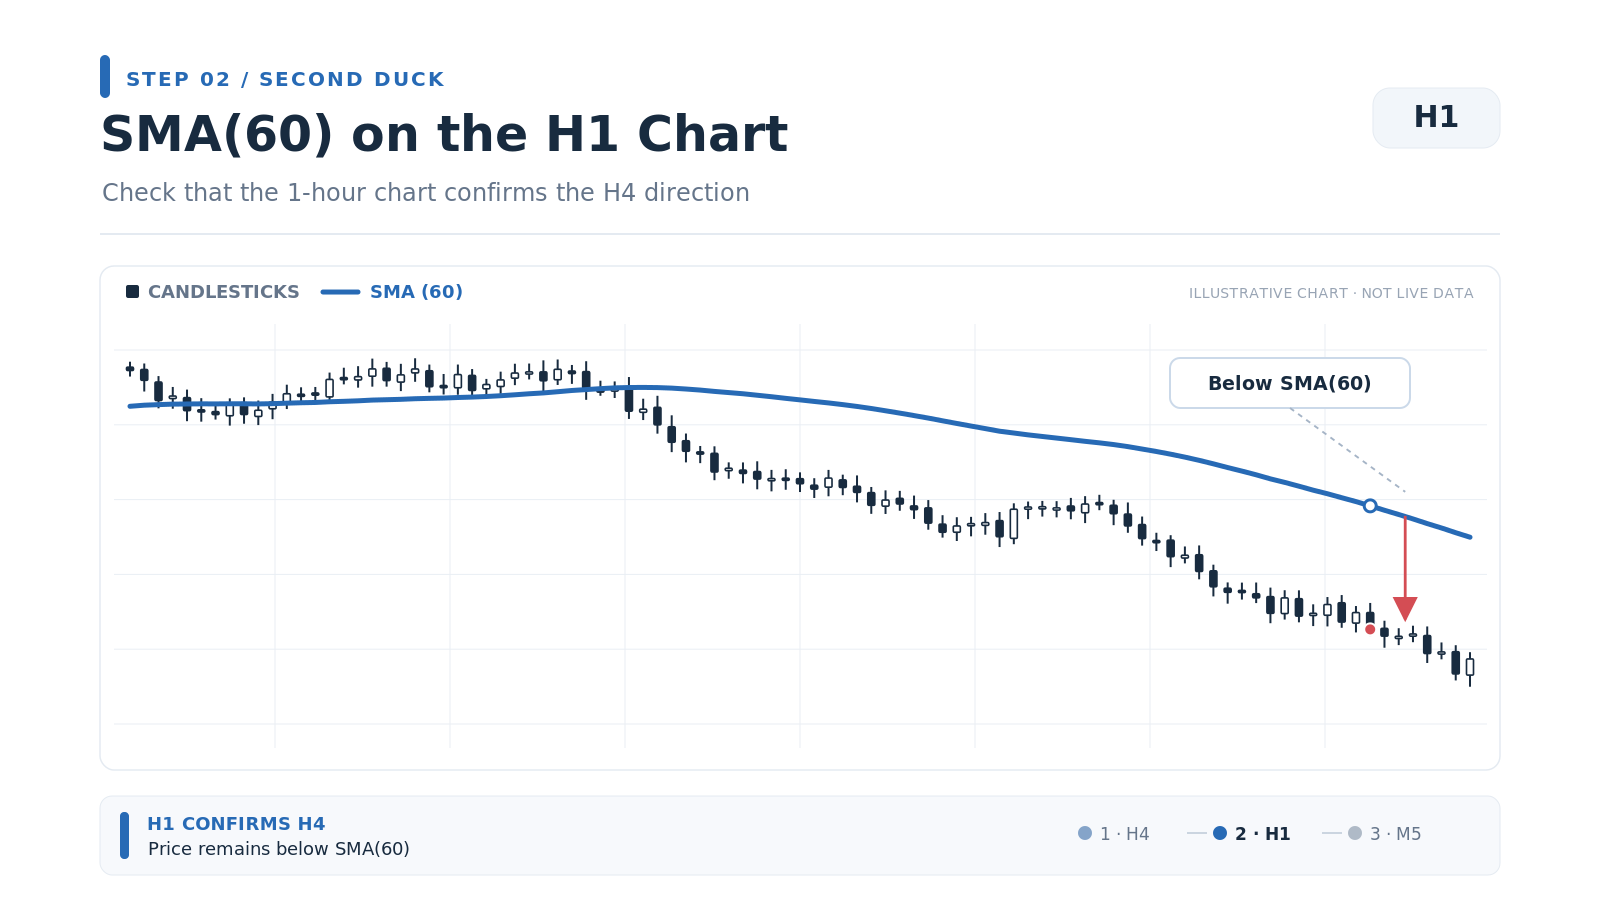
SMA on the hourly chart
Third Duck
Only after the first two conditions have been met should you move to the M5 timeframe (5-minute chart).
At this stage, traders wait until the price crosses the SMA 60 line from above to below. This crossover serves as an entry signal.
For additional confirmation, you can wait until the price breaks below the nearest recent low after crossing the moving average.
The trade is opened once the price crosses the SMA on the M5 timeframe.
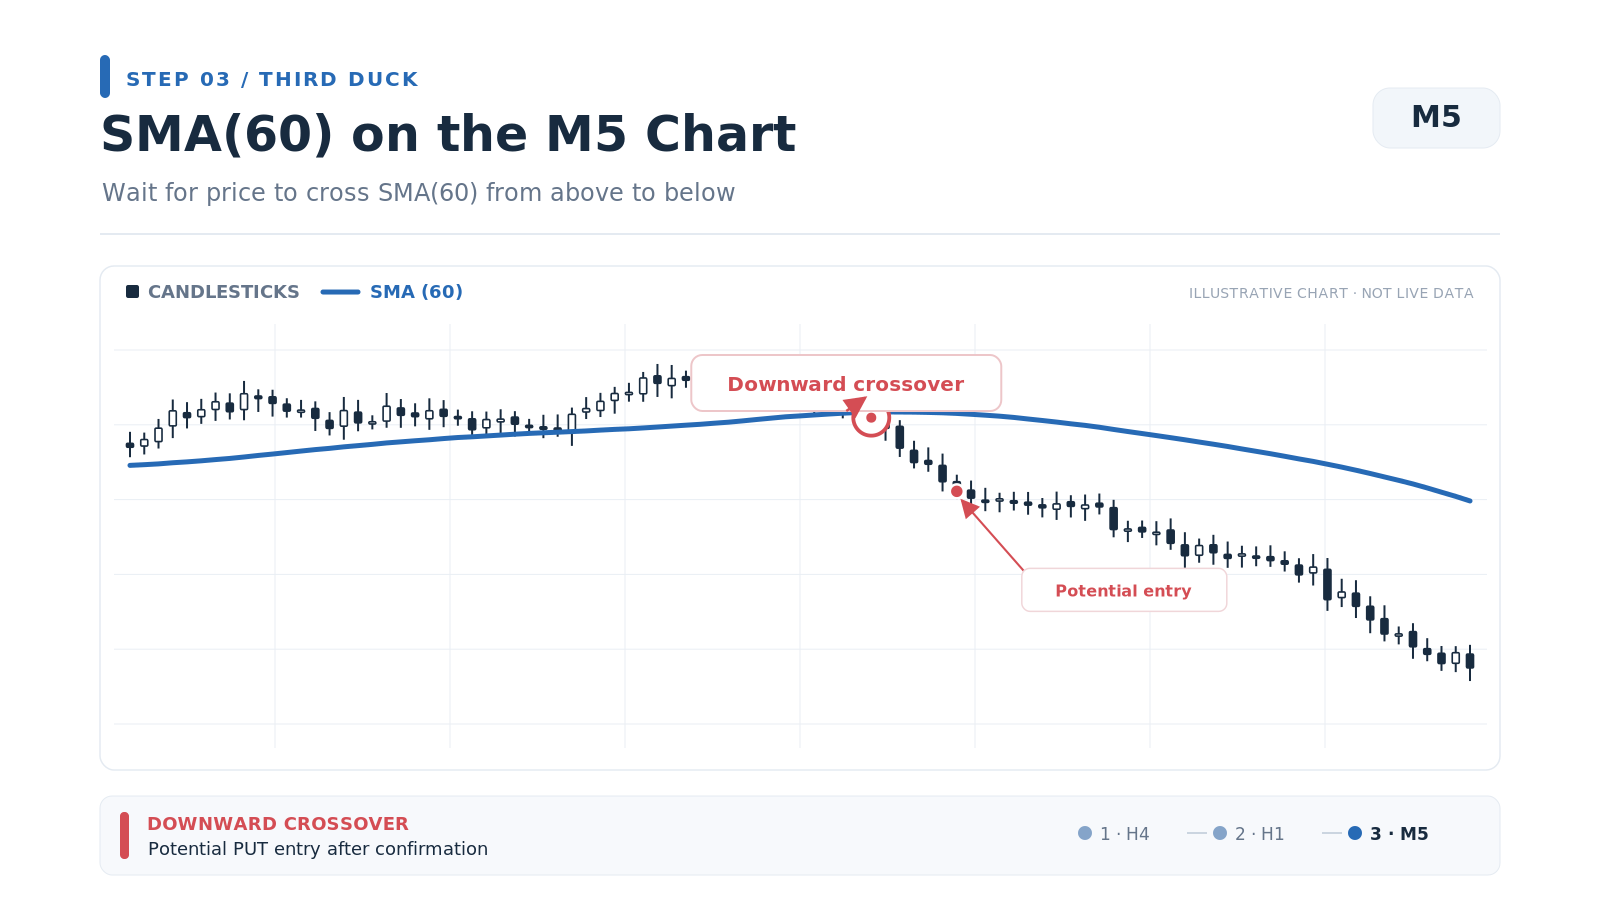
SMA on the M5 chart
How to Trade Binary Options Using the Three Ducks Strategy
Now let's move on to binary options trading.
Suppose you are analyzing a particular underlying asset. To apply the strategy, open charts with 5-minute, 60-minute, and 4-hour timeframes. Then activate the SMA indicator with a period of 60 on each chart.
First, examine the 4-hour chart. Your goal is to determine the position of the SMA 60 relative to the current asset price.
If the price is above the SMA, the market is clearly bullish, and you should consider purchasing a CALL option. If the price is below the SMA 60, a bearish trend dominates, meaning you should consider a position that benefits from falling prices.
Next, move to the hourly timeframe. Make sure that the chart confirms the same trend identified on the 4-hour chart—in other words, the second duck must follow the first.
If the trends match, proceed to the third step.
However, if the hourly chart contradicts the first duck and indicates an opposite trend, you should completely abandon the Three Ducks strategy for that particular asset. Instead, switch to another trading strategy or choose a different financial instrument.
Finally, the third step involves analyzing the M5 chart. If it confirms the trend identified by the previous two ducks, you should consider purchasing a CALL or PUT option, depending on the direction of the price movement.
If the M5 chart contradicts the previous signals, you will need to switch strategies or choose another underlying asset and start your analysis again.
As you can see, each duck serves a specific purpose. Together, they help traders develop a more accurate understanding of market conditions.
The 4-hour timeframe (H4) identifies the primary market trend, the 1-hour timeframe (H1) provides secondary confirmation, and the 5-minute chart (M5) helps identify suitable trading opportunities.
Considering these advantages, the Three Ducks strategy is an excellent approach to binary options trading.
Key Takeaways
Trending Market – a market condition in which asset prices move consistently upward or downward.
Timeframe – the period of time represented by a single bar or candlestick on a price chart.
SMA Indicator – a Simple Moving Average that helps traders identify market trends with a high degree of accuracy.