




Trading Options with the Rectangle Pattern
The easy-to-learn Rectangle strategy for binary options is based on support and resistance lines. It is suitable for periods of market stagnation when prices remain in a sideways trend for an extended period.
In this article, we will explore how the Rectangle pattern works in binary options trading. You will discover an indicator-free trading strategy that generates good profits and does not require specialized skills. Even beginners can use it to trade successfully.
Topics Covered:
How does the Rectangle pattern work?
Identifying the Rectangle pattern
Trading options with the Rectangle strategy
How Does the Rectangle Pattern Work?
A rectangle is a technical analysis pattern that reflects certain recurring behaviors in financial markets. It appears when prices move exclusively between support and resistance levels for an extended period.
The longer the asset’s price stays within the rectangle, the greater the likelihood that the pattern will soon be completed. In addition, the narrower the pattern, the stronger the momentum when the price breaks through one of its boundaries—in other words, the more pronounced the price movement.
The rectangle is a continuation pattern, meaning its formation signals that the prevailing trend will continue. In binary options trading, it is one of the easiest patterns to identify.
The pattern is considered complete only when the price breaks through one of its boundaries while maintaining its original direction—the trend that preceded the rectangle’s formation. There are both bullish and bearish versions of the pattern.
A rectangle lasts between one and six months. A shorter formation lasting less than four weeks is considered a different continuation pattern: a flag. On average, the Rectangle pattern lasts 12 weeks.
How to Identify the Rectangle Pattern
Following an upward or downward trend, prices sometimes pause before resuming their previous direction. During these quiet periods, the asset’s price moves between support and resistance levels.
To identify a rectangle, look for two local highs and two local lows that can be connected with horizontal, parallel lines. The pattern’s boundaries are defined by support and resistance.
The rectangle’s upper boundary must include at least two local highs at the same price level. Similarly, the lower boundary must be formed by two or more local lows at the same price level.
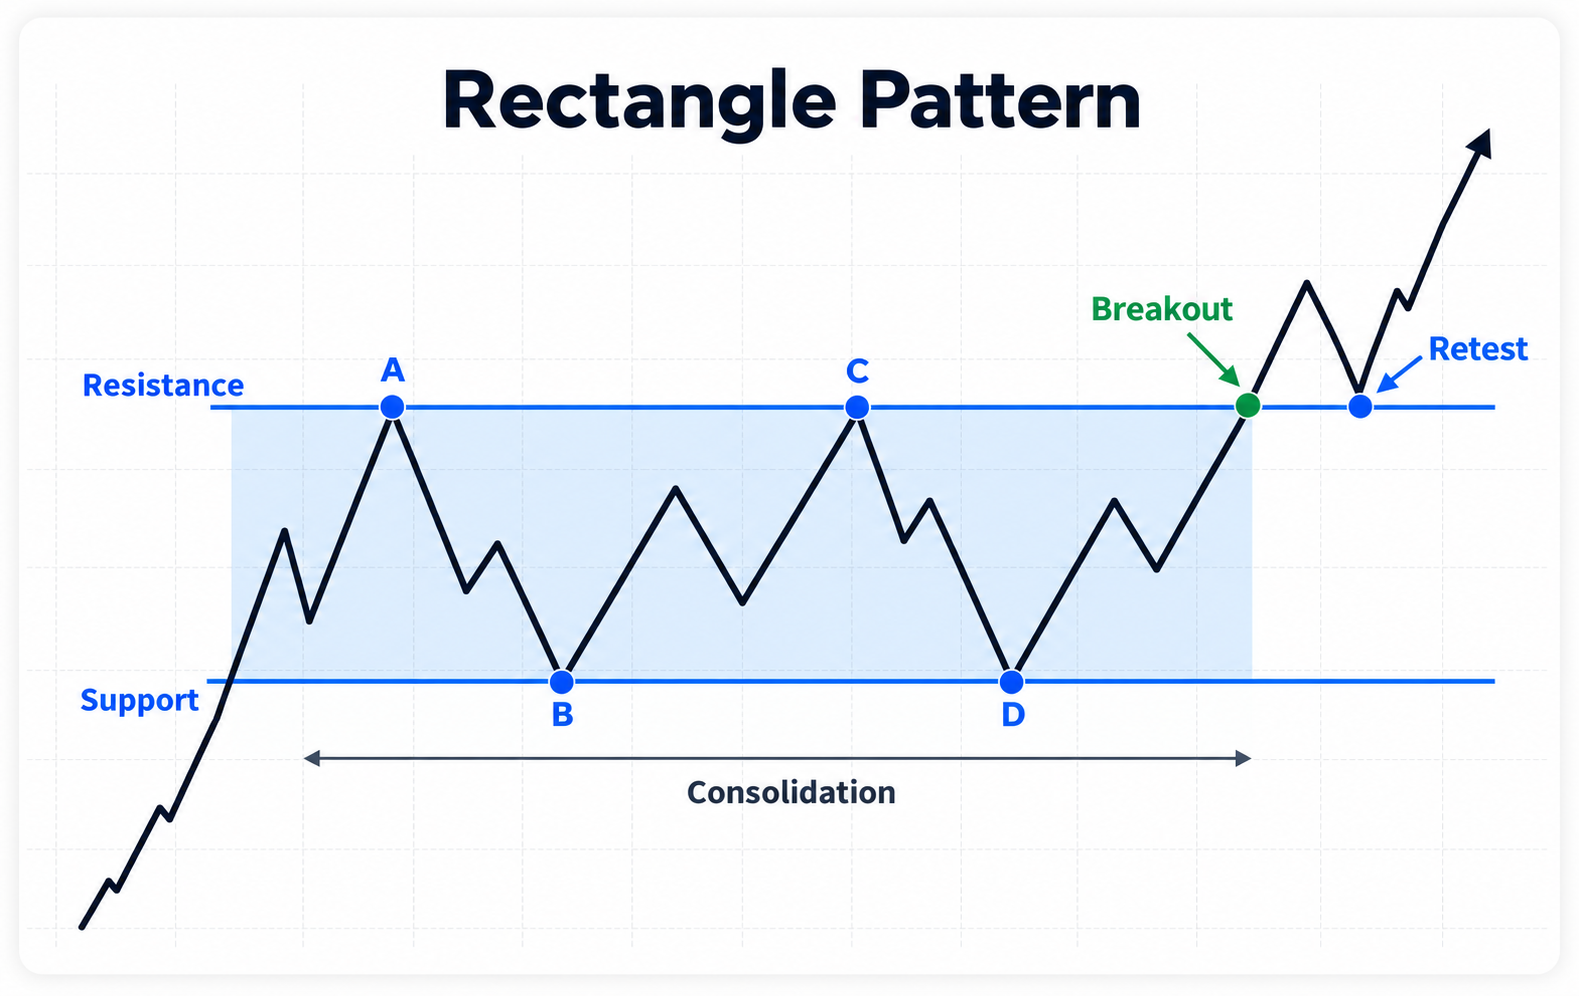
An example of a Rectangle pattern in technical analysis
Visually, a rectangle can resemble an extended flag. Although it is a continuation pattern, it sometimes leads to a reversal. This is why you should enter a binary options trade only after the price breaks through one of the pattern’s boundaries.
Remember that trading volume should not decline while the pattern is forming. It will increase significantly during the breakout.
To confirm the rectangle, make sure the price has crossed the trendline. The pattern can sometimes take more than 10 weeks to form. A binary options trader should be ready to enter a trade immediately after the breakout.
The price target equals the rectangle’s full height added to the resistance level in an uptrend or subtracted from the support level in a downtrend. For an upward trend, measure the rectangle’s height and add it to the price at its upper boundary. The resulting value is the price target. For a downward trend, do the same in the opposite direction, projecting the target below the pattern.
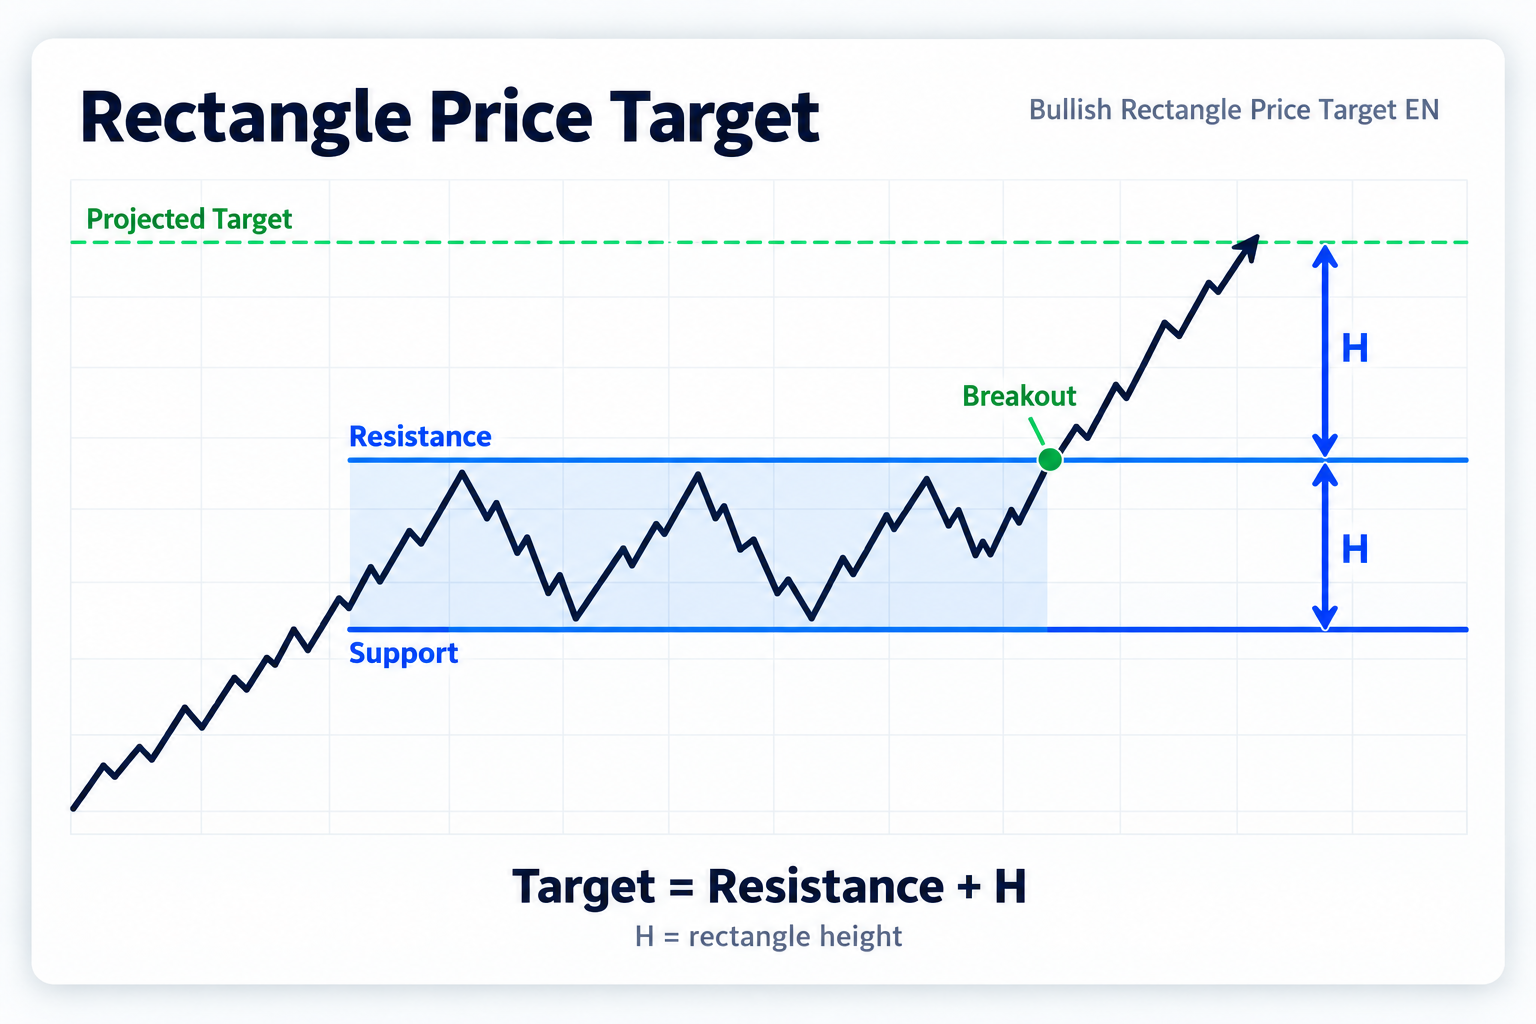
Calculating the price target for a bullish Rectangle pattern
Trading Binary Options with the Rectangle Strategy
Trading 60-Second / 30-Minute / 60-Minute Options
When trading standard 60-second / 30-minute / 60-minute options, the investor should act after the price breaks through one of the rectangle’s boundaries. Trading volume will begin to increase at this point. As you already know, a rectangle can lead to a reversal, so enter the trade only after the breakout.
Be ready to enter a trade immediately in the direction of the original trend. If the price breaks above the pattern’s upper boundary, you can purchase a CALL option. Otherwise, if it breaks below the lower trendline, purchase a PUT option.
Low trading volume and weak momentum will lead to a reversal, causing the investor to incur a loss.
If prices were initially rising, the investor can take a risk and purchase a CALL option when the price bounces off the lower trendline. Unless unexpected news triggers a reversal, the contract will generate a profit.
If prices were initially falling, the investor can take a risk and purchase a PUT option when the price moves downward after touching the pattern’s upper boundary. If the price stays between the upper and lower trendlines, the contract will generate a profit.
Trading One Touch Options
If prices were initially rising, purchase a One Touch binary option after the price breaks above the rectangle’s upper boundary—the resistance level. Make sure trading volume increases significantly at the same time. Also confirm that the projected price target is above the option’s target price set by the broker. Only then should you purchase the One Touch option.
If the preceding trend was downward, enter the contract after the price breaks below the lower trendline—the support level. In this case, the projected price target must be below the target price set by the broker for the One Touch binary option.
Trading No Touch Options
Options of this type are the safest because they do not require a precise price target forecast. The price simply needs to remain around the same level after the breakout until expiration. The option will result in a loss only if the trend reverses.
Purchase a No Touch contract immediately after the asset’s price breaks through the pattern’s upper or lower boundary. Be ready to enter the trade as quickly as possible.
A No Touch option is ideal when the price breaks out of the rectangle within three months. This is because the strength of the subsequent rise or fall, and the likelihood of reaching the projected price target, depend on how long the pattern takes to form. An early breakout suggests that the target price set by the broker may not be reached.
If the original trend was upward, you can take a risk and purchase a No Touch option when the price bounces off the rectangle’s lower boundary. If the price remains within the pattern’s boundaries until expiration, the contract will generate a profit.
If prices were initially falling, the investor can take a risk and purchase a No Touch contract when the price begins to decline after touching the upper boundary. The option will generate a profit if the price stays within the pattern.
Trading Double One Touch Options
If you expect major news that will affect the underlying asset’s price before expiration, consider purchasing a Double One Touch option.
If the news supports further movement in the direction of the original trend or causes a sharp trend reversal, the option will generate a profit. Otherwise, you will incur a loss.
Trading Double No Touch Options
If the price breaks out of the rectangle without a noticeable increase in volume, you can purchase a Double No Touch option. First, make sure no major news that could affect the underlying asset’s price is scheduled before expiration. If volatility remains at its current level, the option will generate a profit.
Summary
Market stagnation — a condition in which financial market indicators stop changing.
Trend continuation pattern — a chart pattern indicating that the prevailing trend is highly likely to continue.