




Triangle Pattern Trading Strategy for Binary Options
The Triangle pattern is a useful tool for market analysis when trading binary options, allowing traders to predict future price movements with a high degree of accuracy. This chart pattern can be applied to various timeframes and underlying assets.
This article provides a detailed explanation of triangle patterns in technical analysis. You will also learn a practical strategy for trading binary options. Additionally, we will explain how to identify support and resistance levels on price charts.
In This Article, You Will Learn:
What Is the Triangle Pattern?
Support and Resistance Levels
Types of Triangle Patterns in Technical Analysis
How to Trade Binary Options Using the Triangle Strategy
What Is the Triangle Pattern?
The Triangle is a classic technical analysis chart pattern. Like other patterns, it allows traders to visualize market trends, analyze price movements, and identify entry and exit points based on historical price data.
Triangle patterns can be identified across various trading timeframes. However, the longer the timeframe, the more accurate the predictions based on the pattern tend to be.
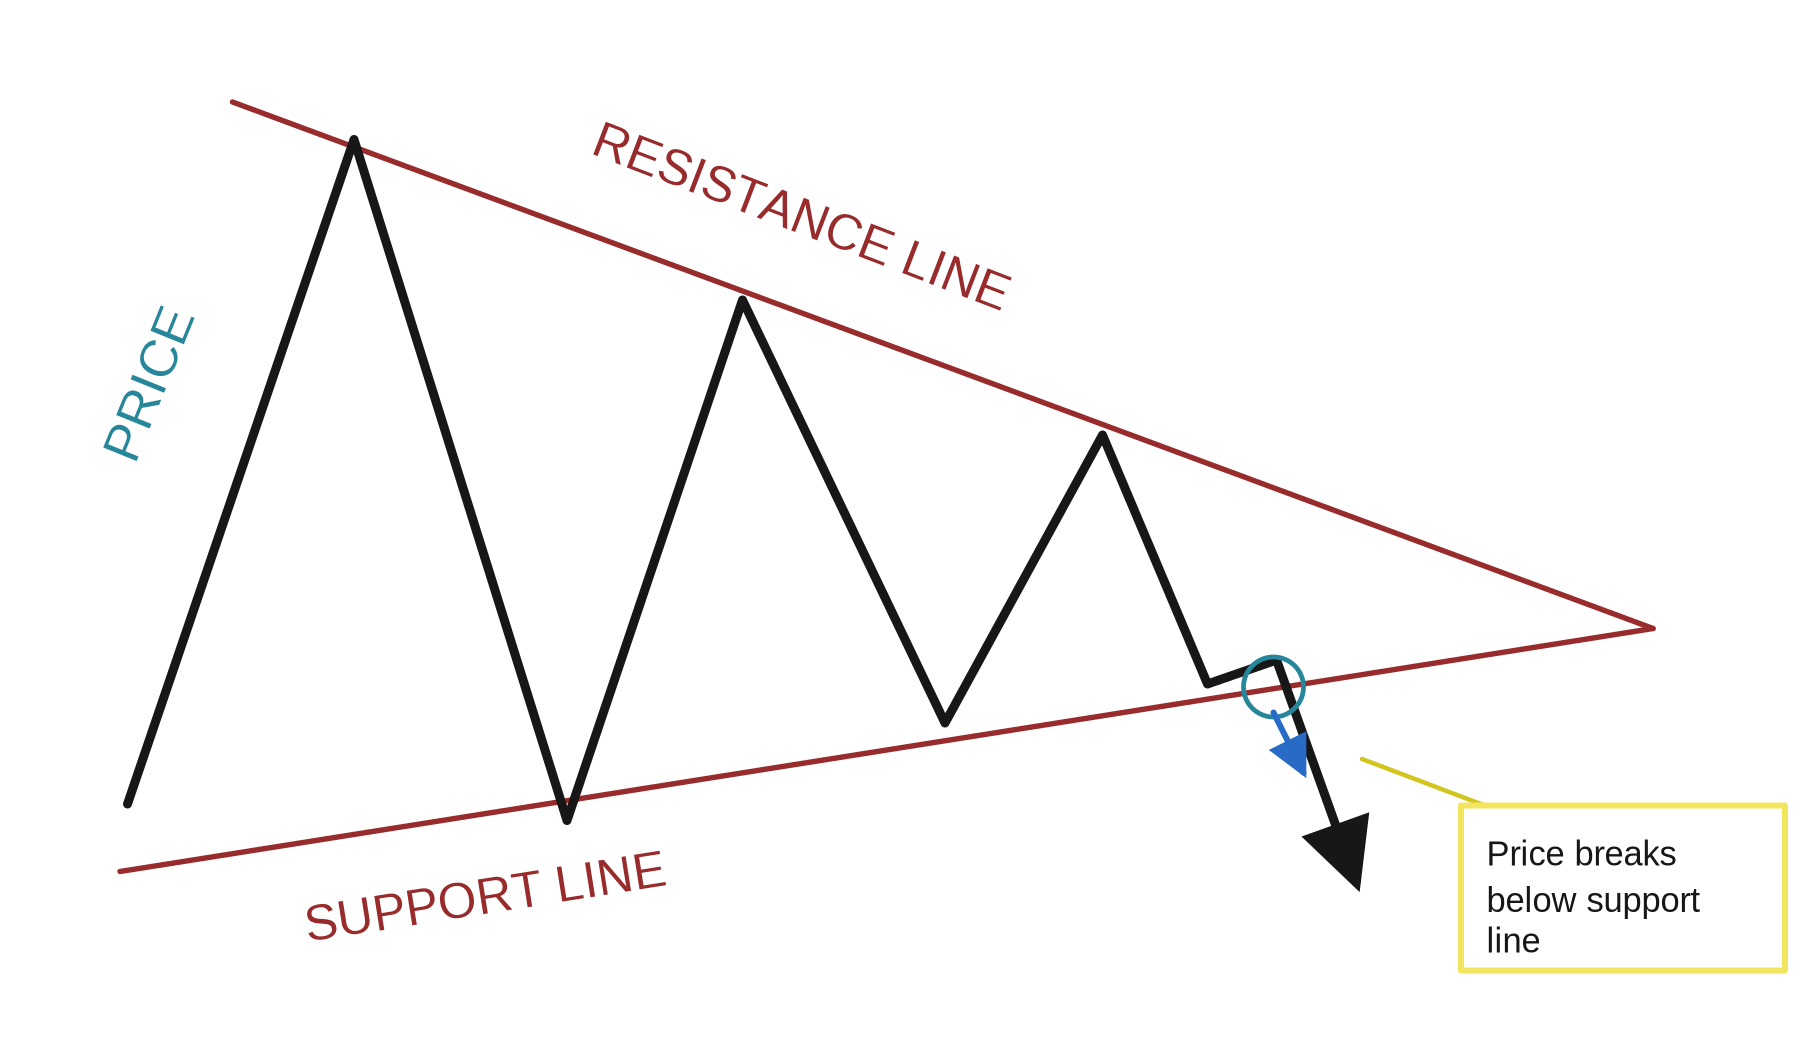
Triangles are divided into four types depending on the market trend: descending, ascending, expanding, and symmetrical. The upper boundary acts as a resistance level, while the lower boundary serves as a support level.
Support and Resistance Levels
When analyzing the market, traders identify recurring patterns at certain price levels, represented by horizontal lines. When the price reaches one of these levels, it may reverse direction.
A support level is a price level at which an asset's price tends to reverse when approaching it from above. When the price attempts to rise, it encounters a "ceiling"—a point where the price movement changes direction and a reversal begins. A support level prevents an asset's price from falling further.
A resistance level is a price level at which an asset's price tends to reverse when approaching it from below. When the price moves downward, it encounters a "floor." At this point, enough buyers enter the market to gain an advantage over sellers and prevent the asset's price from declining further.
How to Identify Support and Resistance Levels
To identify support and resistance levels, you need to locate points where price movements temporarily stop. These are moments when a significant number of buyers or sellers enter the market.
A support level is determined by previous lows reached by the asset. It is always located below the current market price. If the upward trend continues, the price bounces off the support level and attempts to reach a new high. However, if the price breaks through support, the trend may reverse, causing the asset's value to decline.
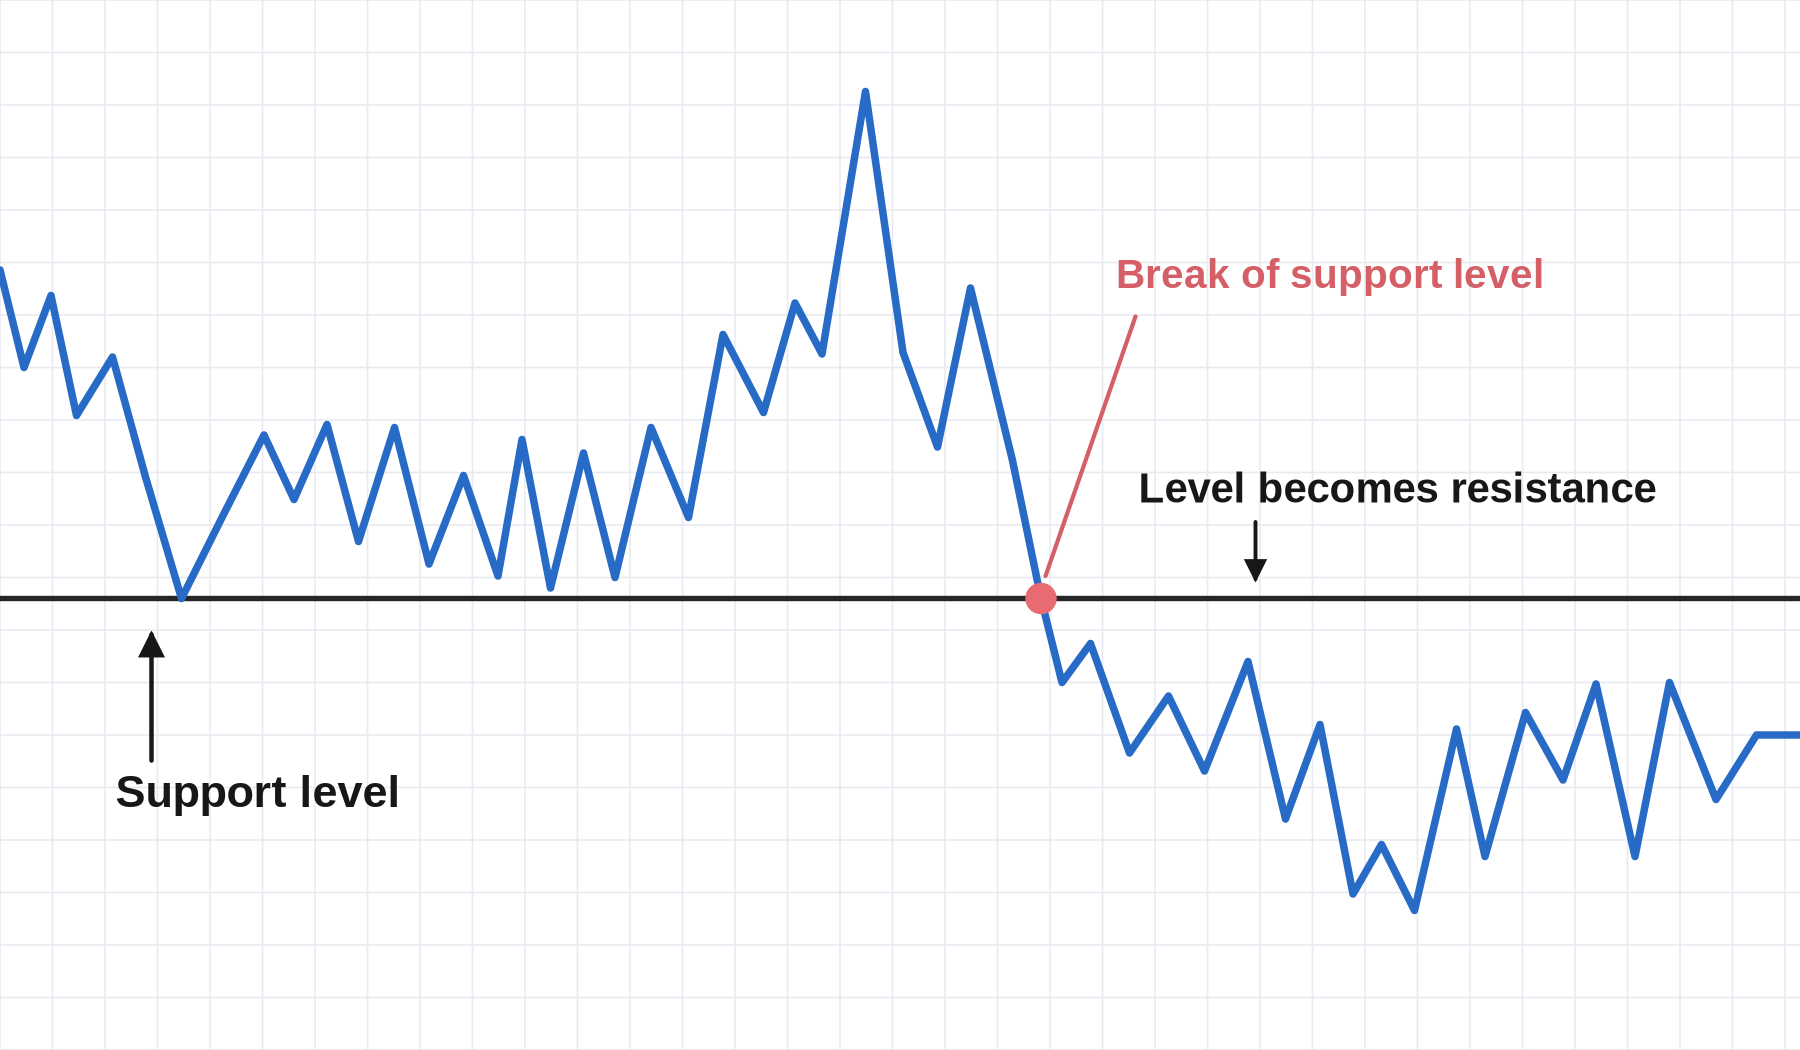
Similarly, a resistance level is determined by previous price highs. Resistance is always located above the current market price. If the downward trend continues, the price typically bounces off the resistance level and attempts to reach a new low. Otherwise, the price may break through resistance, potentially reversing the bearish trend into a bullish one.
Types of Triangle Patterns in Technical Analysis
As mentioned earlier, there are four types of triangle patterns. Let's examine each of them.
Ascending Triangle
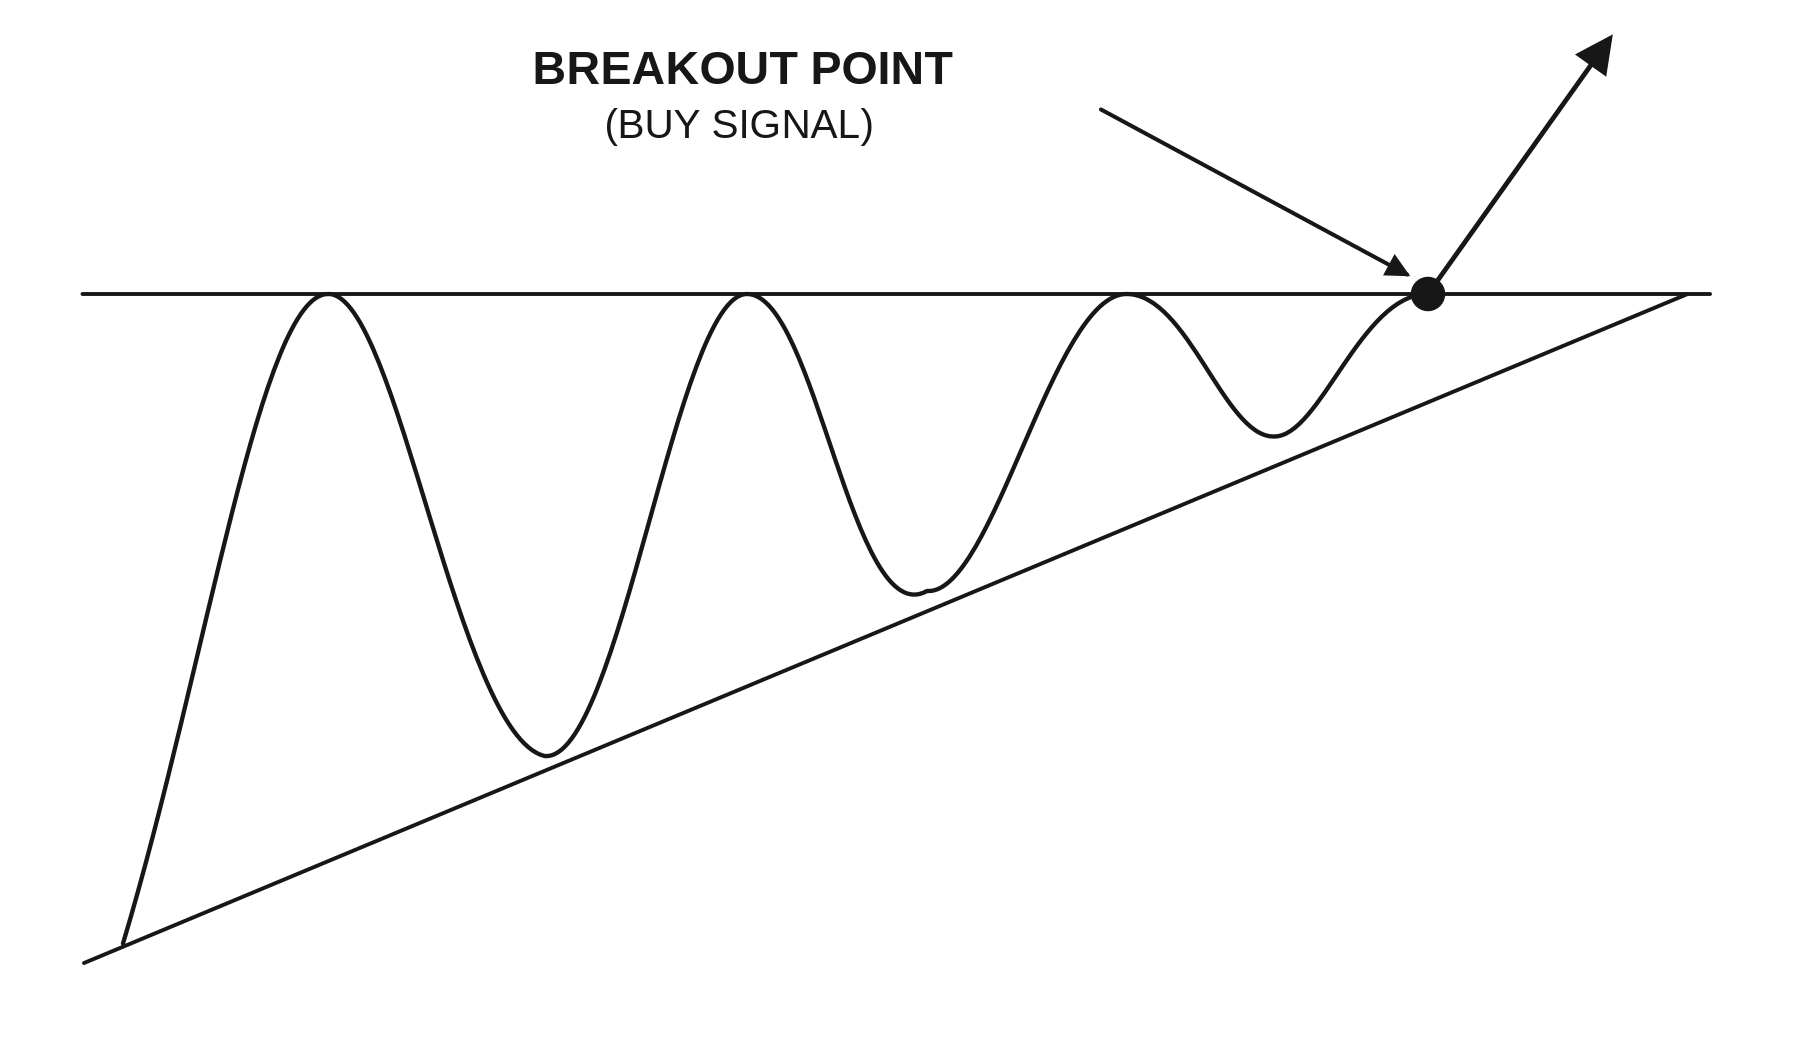
In an Ascending Triangle (a bullish market pattern), the upper boundary is horizontal and acts as a resistance line. The lower boundary serves as an upward-sloping support line. Several waves of price declines and recoveries may occur within this type of triangle.
An ascending triangle is considered complete once the price breaks through the resistance line from below. In this case, traders should consider purchasing a binary option predicting a price increase (UP).
Descending Triangle
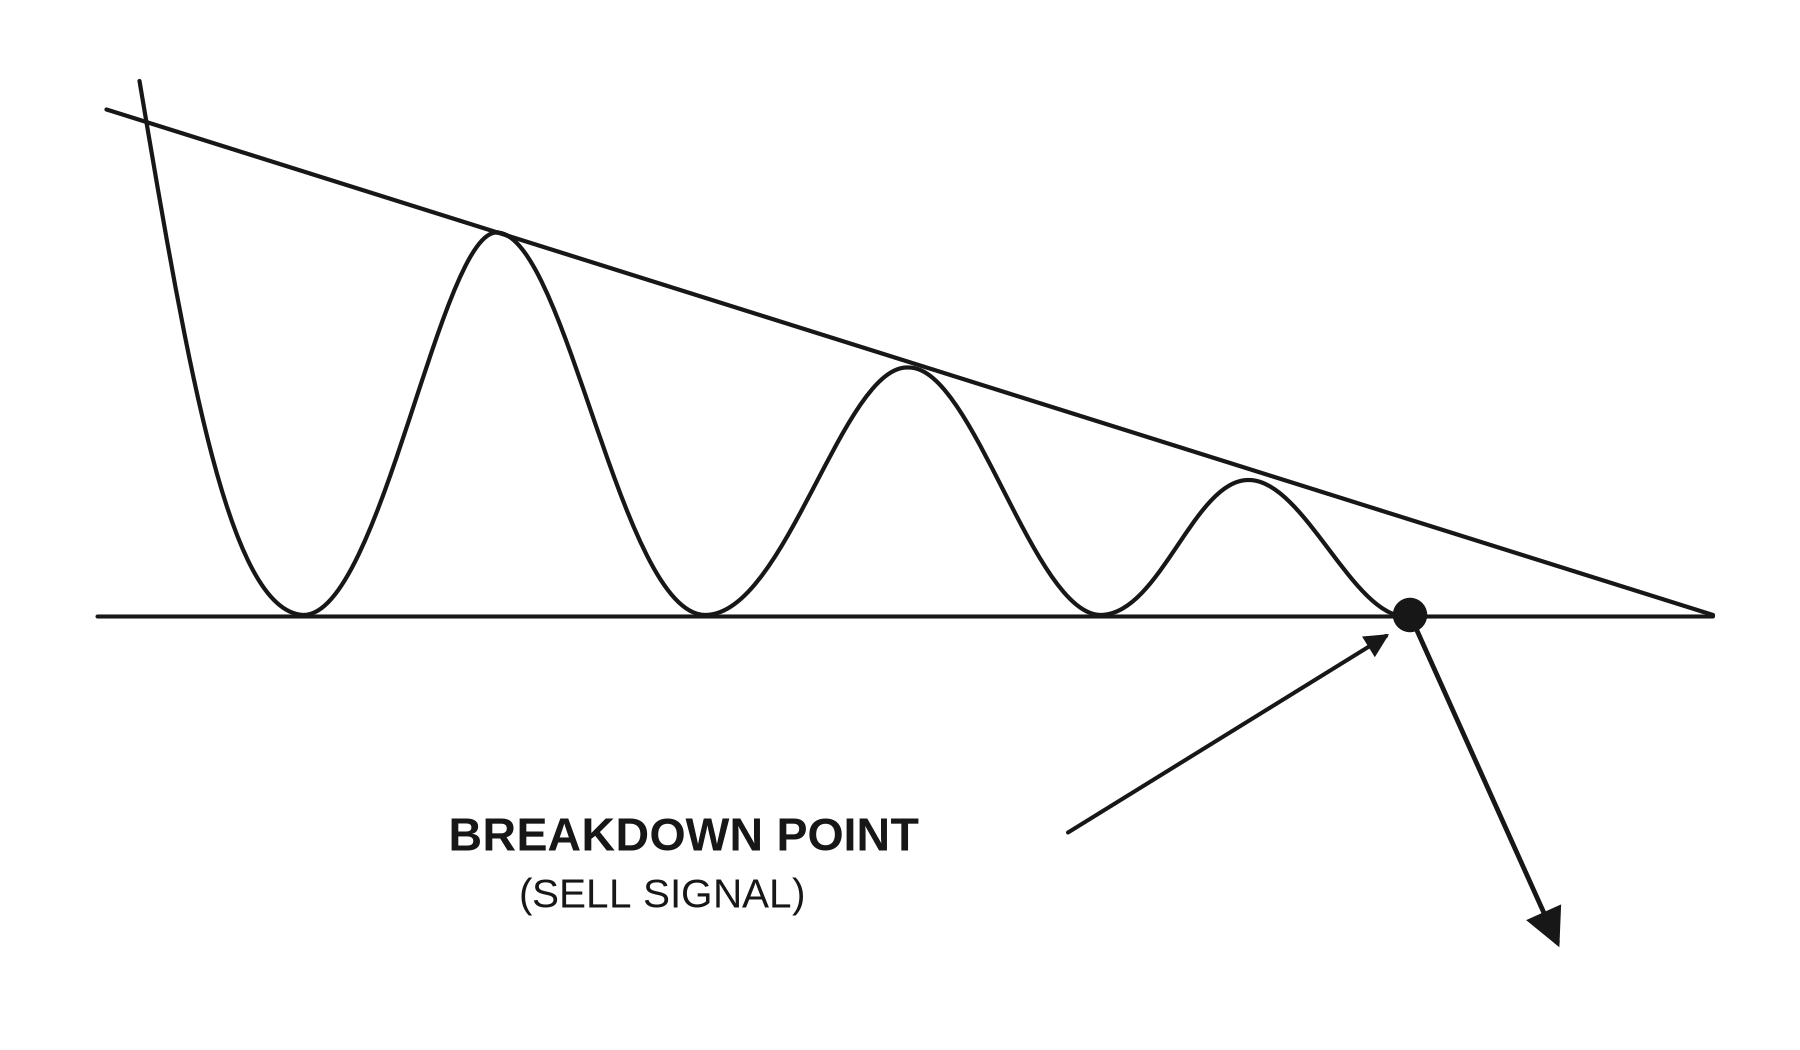
A Descending Triangle (a bearish market pattern) forms when an asset's price is declining. Its lower boundary is horizontal and acts as a support line. The upper boundary is a downward-sloping resistance line that follows the bearish trend.
This type of triangle is considered complete when the asset's price breaks below the support line after the third wave. This signals an opportunity to purchase a binary option predicting a price decrease (DOWN).
Symmetrical Triangle
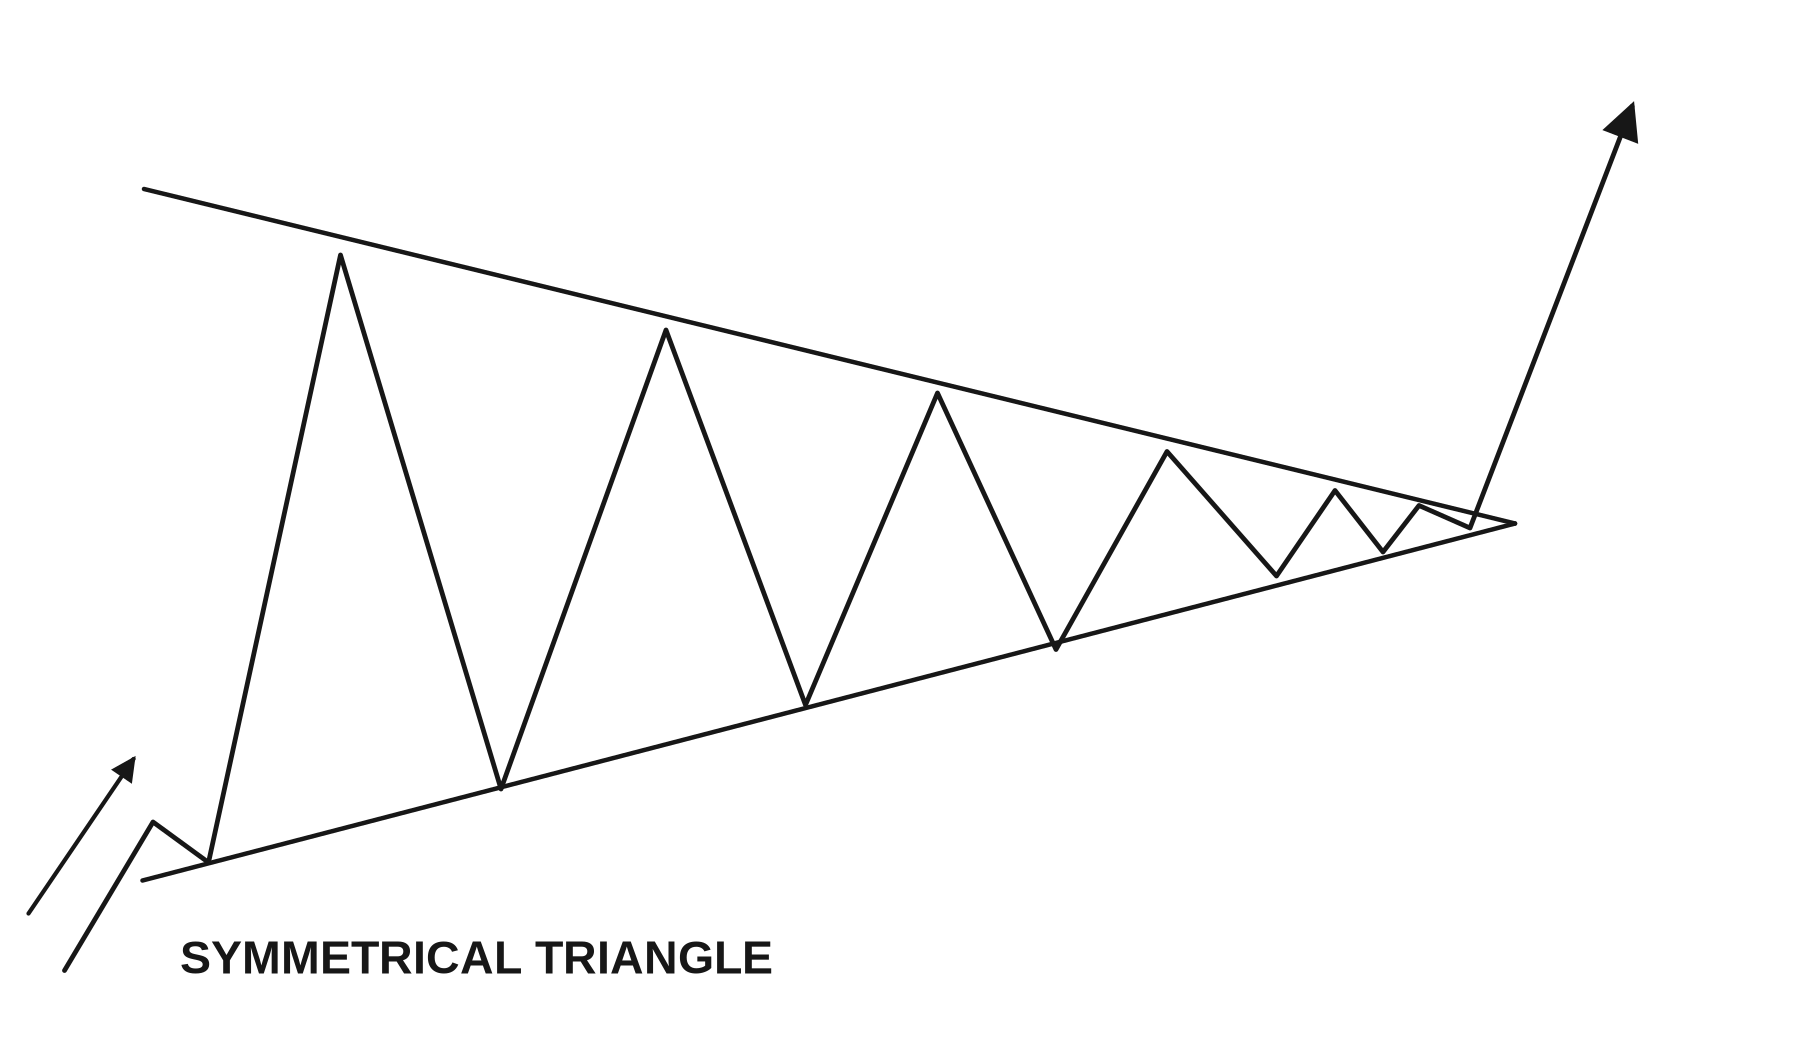
In a Symmetrical Triangle, the downward slope of the resistance line mirrors the upward slope of the support line. In this situation, purchasing options is not recommended because it is difficult to predict the future market trend with sufficient accuracy. It is better to wait until the price breaks through one of the triangle's boundaries.
If the price breaks through the resistance line, purchase an UP binary option.
If the price breaks through the support line, purchase a DOWN binary option.
Expanding Triangle
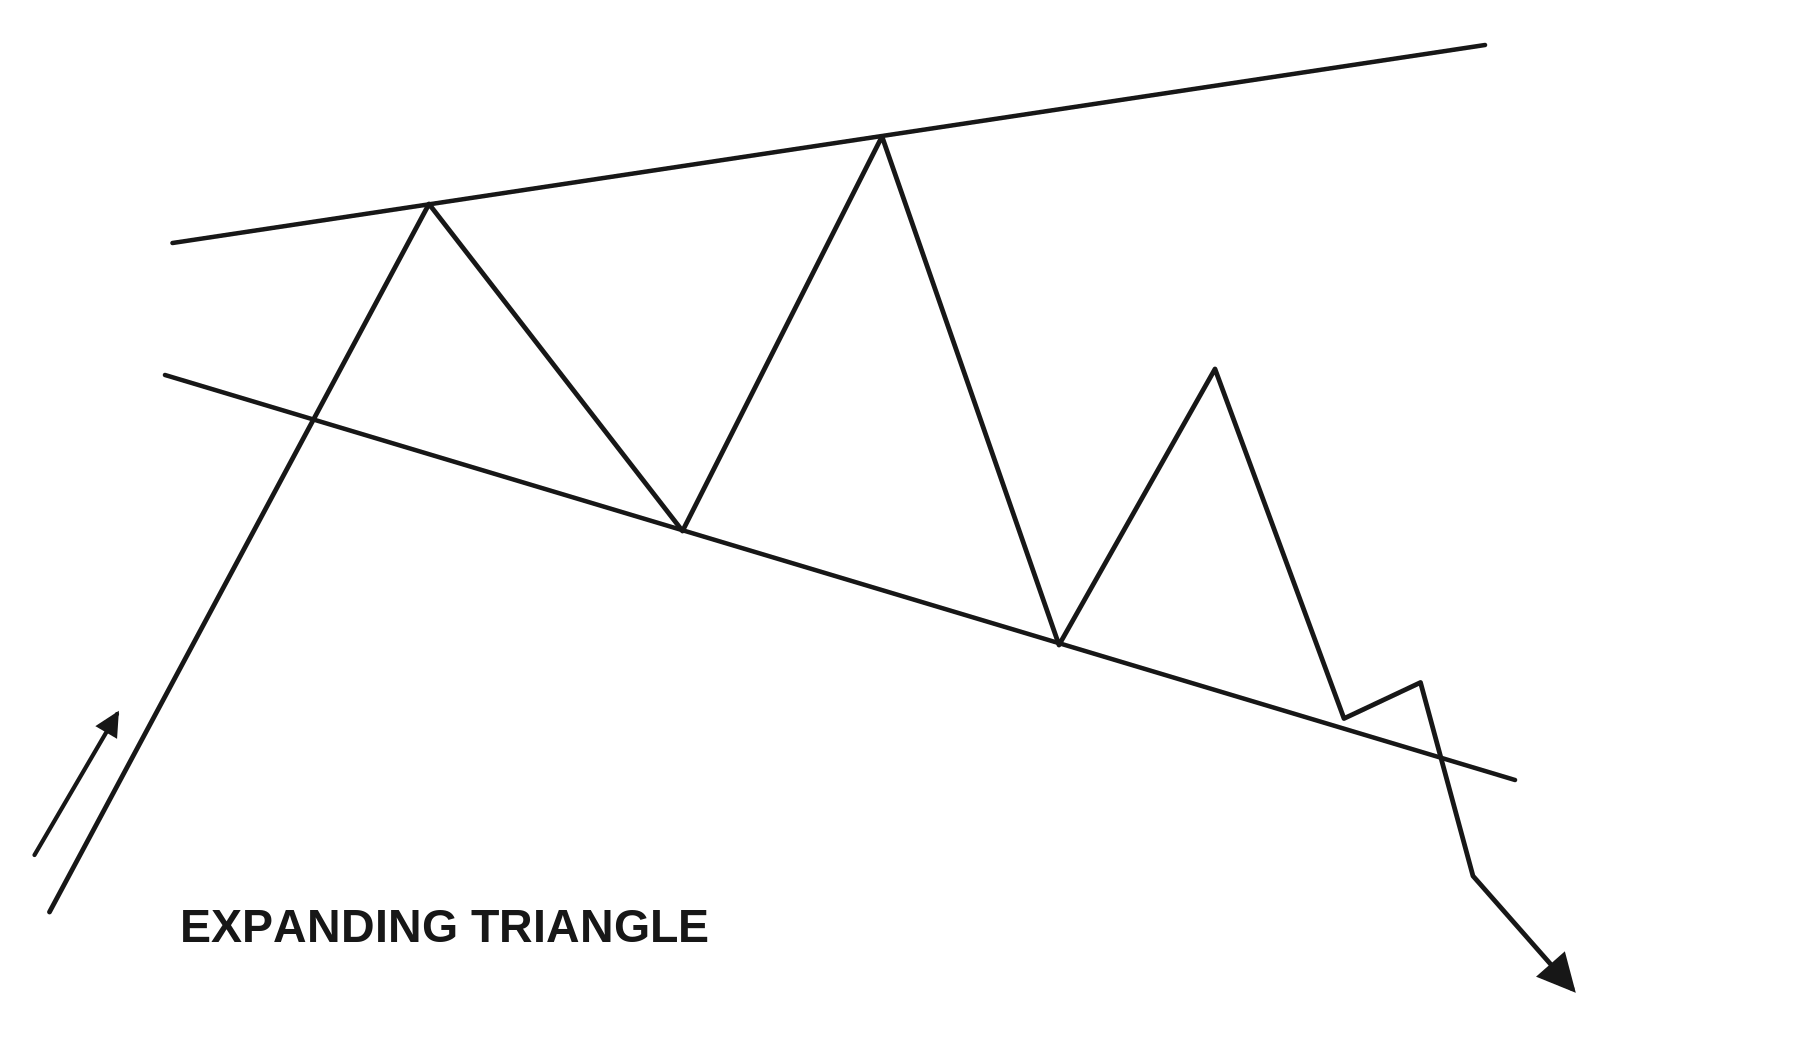
An Expanding Triangle, also known as a broadening triangle, is a pattern that indicates market uncertainty. It appears when the market lacks a clear direction, and neither buyers (bulls) nor sellers (bears) can generate sustained price momentum. False breakouts are common in this pattern, making it unsuitable for consistent trading.
When an expanding triangle appears, it is generally better to avoid purchasing binary options because the future trend direction remains unclear. However, if you are willing to take the risk, consider purchasing an UP option after the price breaks through the upper boundary. If the price breaks below the lower boundary, purchase a DOWN option.
How to Trade Binary Options Using the Triangle Strategy
By correctly identifying a triangle pattern on a chart, you can make more accurate predictions when trading binary options.
Using the Triangle Pattern in a Bullish Market (Ascending Triangle)
Identifying an Ascending Triangle
The Ascending Triangle pattern indicates that buyers dominate the market. It is a trend continuation pattern, meaning it typically appears during an upward trend. Trading volume decreases as the pattern develops and increases during the breakout.
The resistance level is formed by the triangle's horizontal upper boundary, which connects at least two peaks (local highs) at approximately the same price level. Similarly, the ascending support line, indicating bullish momentum, is drawn by connecting consecutive local lows.
Important: Each subsequent local low must be higher than the previous one.
An ascending triangle is considered confirmed when the price breaks through the resistance level with increasing trading volume. The projected price target after the pattern is completed is calculated by adding the triangle's height (its left vertical side) to the upper boundary.
The pattern may take several weeks to several months to complete. After the breakout, the former resistance level becomes a new support level.
Triangle Strategy in a Bullish Market
Trading 60-Second / 30-Minute / 1-Hour Options
When trading standard binary options (1-minute, 30-minute, or 60-minute contracts), traders should purchase a CALL option after the price crosses the horizontal resistance line of an ascending triangle. Trading volume should also be increasing.
It is recommended to use the daily timeframe to identify an ascending triangle pattern and, preferably, a timeframe longer than the option's expiration period to determine the best entry point.
For example, when trading binary options with a 30-minute expiration period, it is advisable to analyze both daily and hourly charts.
Trading One Touch Options
A One Touch option is recommended when the projected target price is higher than the target level specified by the broker. Additionally, the breakout above the resistance level should be accompanied by significant trading volume.
If trading volume is low compared to the volume observed during the formation of the ascending triangle, the asset's price may fail to reach the target level. In this case, the trade will result in a loss.
Trading No Touch Options
If a breakout above the horizontal resistance line of an ascending triangle occurs with high trading volume, you can consider purchasing a No Touch option.
Unless an unexpected reversal occurs due to negative news, the asset's price is expected to remain above the broken resistance level, which has now become a support level. This creates an opportunity to earn a profit.
Since No Touch binary options do not require the price to reach a specific target, traders do not need to worry about how far the asset's price will rise. This is considered the safest and most effective type of contract when trading an ascending triangle.
Using the Triangle Pattern in a Bearish Market (Descending Triangle)
A descending triangle has characteristics similar to an ascending triangle, except that the price breaks below a horizontal support line formed by a series of local lows.
After the breakout, traders can purchase PUT options with expiration periods of 60 seconds, 30 minutes, or 1 hour. Alternatively, they can use One Touch or No Touch options.
To select the most suitable contract, evaluate the payout percentage and expiration time. You should also review the latest news related to the underlying asset.
Trading with a Symmetrical Triangle
When a Symmetrical Triangle forms, trading volume typically decreases. It then rises sharply after the price breaks through the support or resistance level. The upper trendline should slope downward, while the lower trendline should slope upward.
As you already know, a symmetrical triangle can result in a trend reversal. Therefore, traders should only open positions after the price breaks through one of the trendlines.
With ascending and descending triangles, traders can anticipate the likely direction of a breakout. However, a symmetrical triangle is generally considered a continuation pattern, meaning the price often breaks out in the direction of the preceding trend.
This rule does not always apply, so trading decisions should only be made after a confirmed breakout.
If the asset's price breaks above the descending upper trendline (resistance), traders can follow the same approach used for an ascending triangle.
If the price breaks below the ascending lower trendline (support), traders can apply the same strategy used for a descending triangle.
Key Takeaways
Triangle Pattern – a chart pattern representing a narrowing price range in which the asset's price fluctuates between two converging boundaries.
Support Level – a price level at which an asset's price tends to reverse when approaching it from above.
Resistance Level – a price level at which an asset's price tends to reverse when approaching it from below.